 4
4peptides
spectra
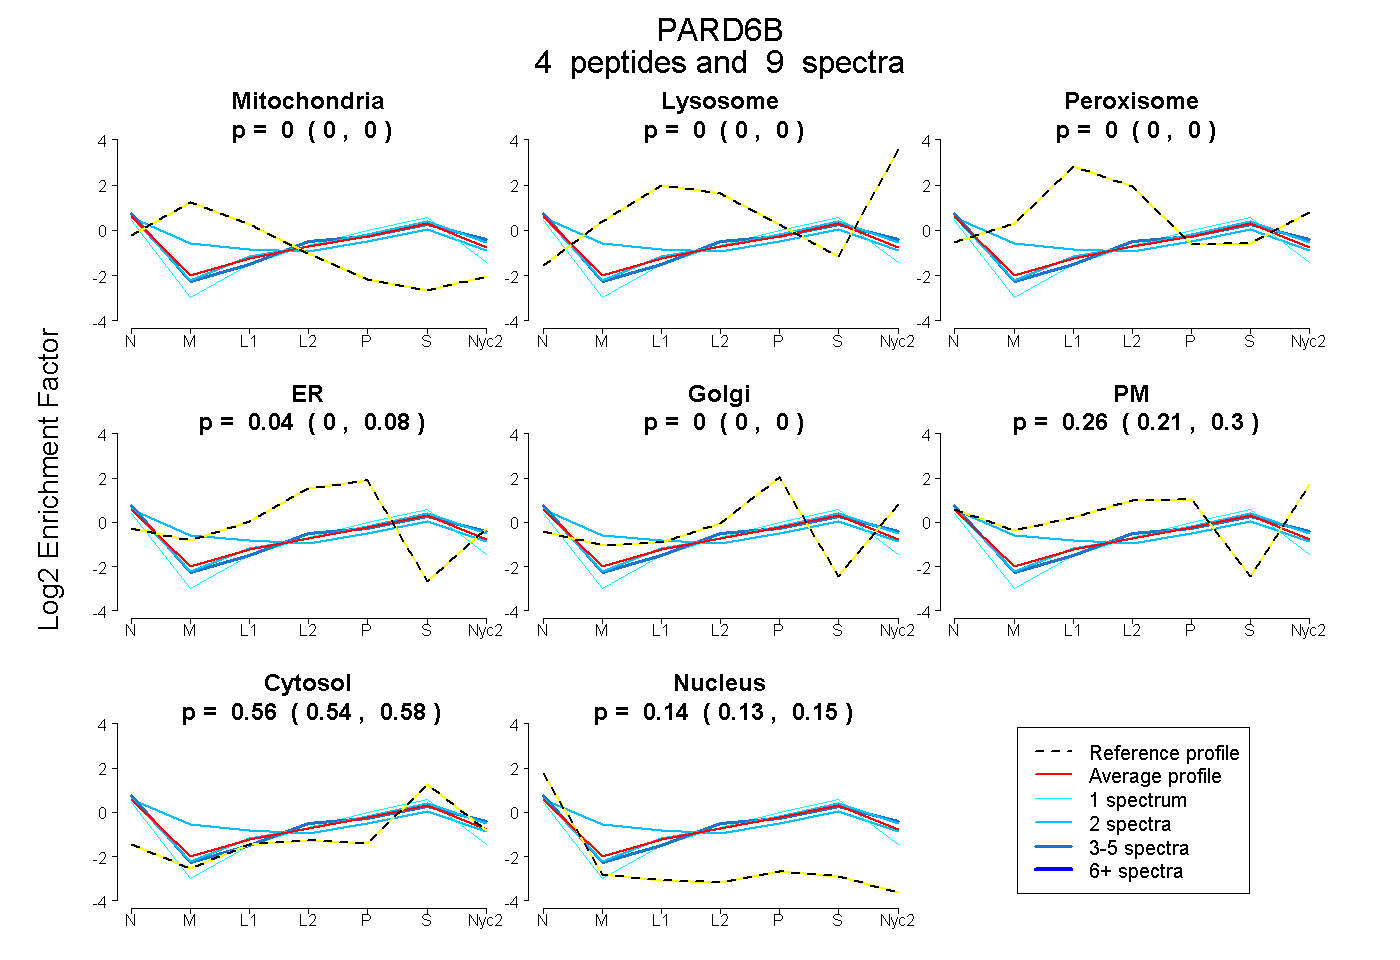
0.000 | 0.000
0.000 | 0.000
0.000 | 0.000
0.000 | 0.080
0.000 | 0.000
0.210 | 0.304
0.539 | 0.575
0.125 | 0.149
1peptide
spectrum
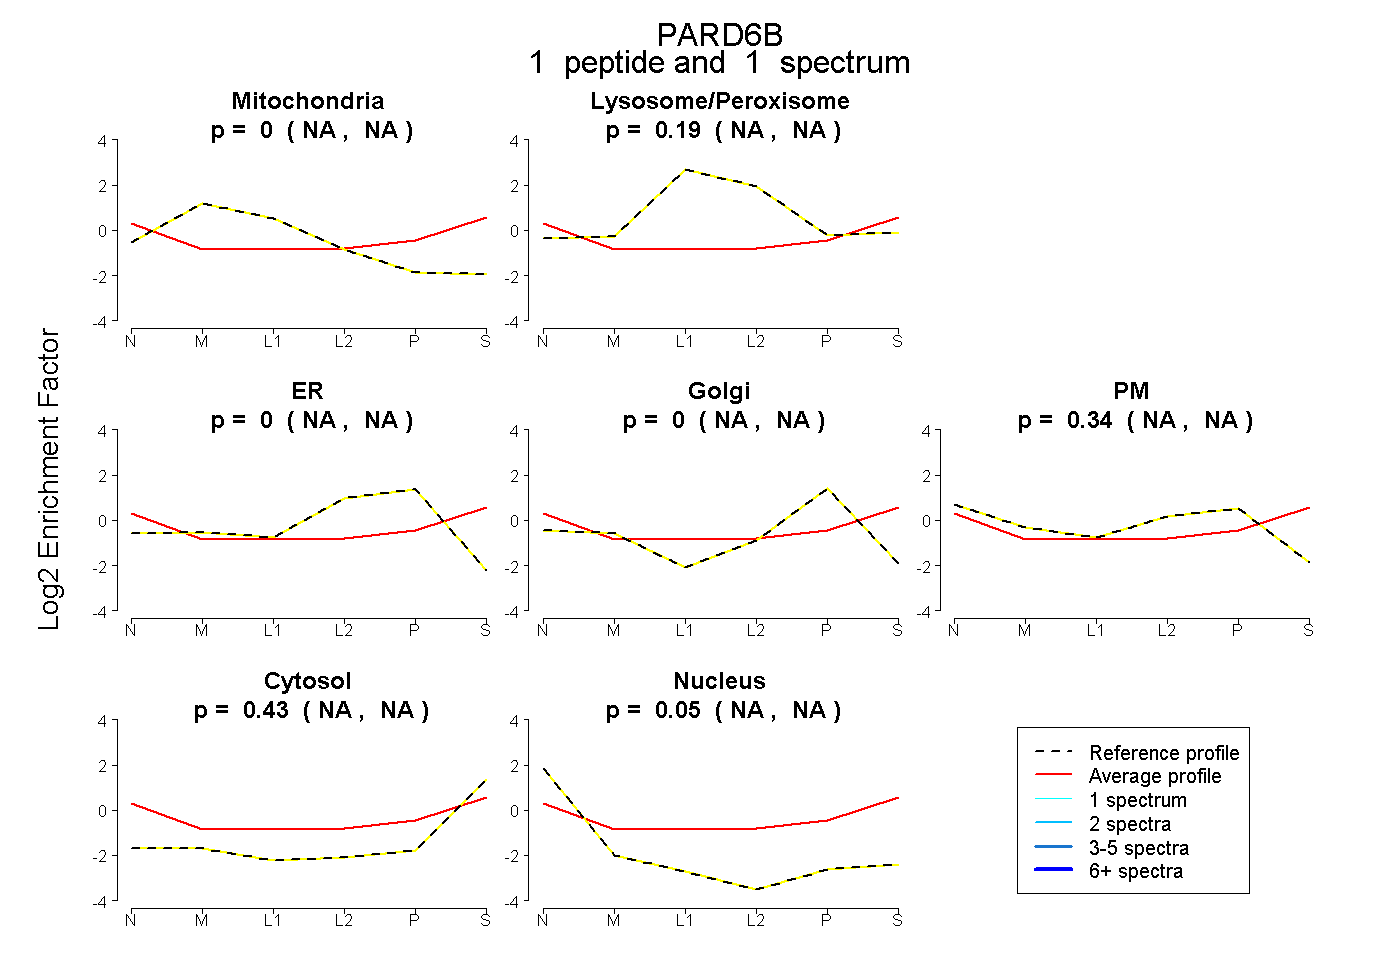
NA | NA
NA | NA
NA | NA
NA | NA
NA | NA
NA | NA
NA | NA
1peptide
spectra

0.000 | 0.000
1.000 | 1.000