 4
4peptides
spectra
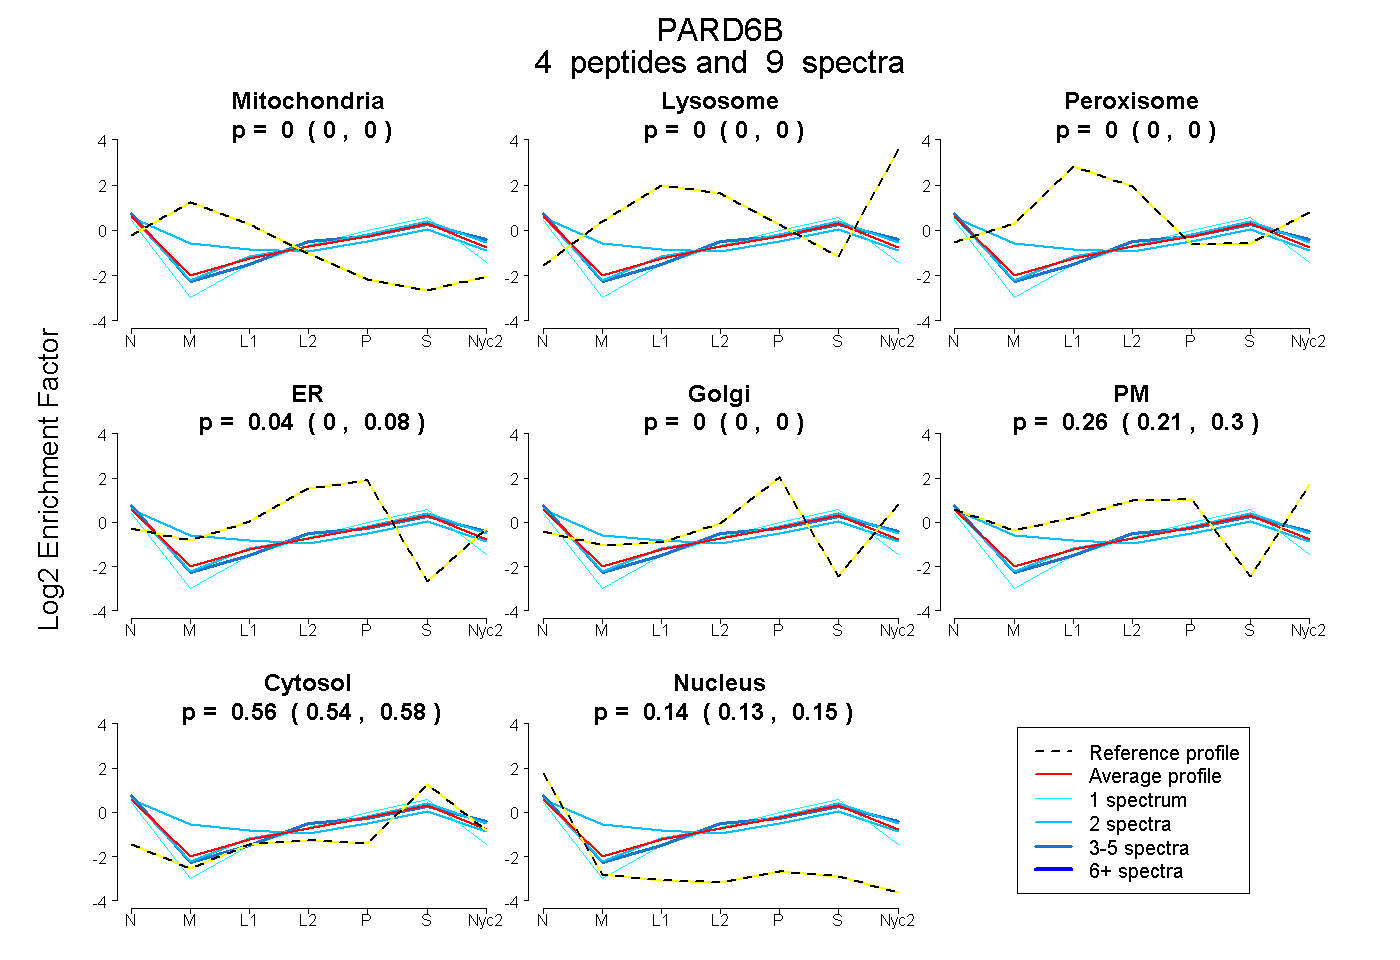
0.000 | 0.000
0.000 | 0.000
0.000 | 0.000
0.000 | 0.080
0.000 | 0.000
0.210 | 0.304
0.539 | 0.575
0.125 | 0.149
| Plot | Mito | Lyso | Perox | ER | Golgi | PM | Cytosol | Nucleus | |||||
| Expt A |
4 peptides |
9 spectra |
|
0.000 0.000 | 0.000 |
0.000 0.000 | 0.000 |
0.000 0.000 | 0.000 |
0.043 0.000 | 0.080 |
0.000 0.000 | 0.000 |
0.261 0.210 | 0.304 |
0.559 0.539 | 0.575 |
0.138 0.125 | 0.149 |
| 4 spectra, NLIITVRPANQR | 0.000 | 0.000 | 0.000 | 0.000 | 0.000 | 0.319 | 0.546 | 0.134 | ||
| 2 spectra, VPGIFISR | 0.000 | 0.000 | 0.000 | 0.000 | 0.000 | 0.305 | 0.582 | 0.114 | ||
| 1 spectrum, FEEFYGLLQHVHK | 0.000 | 0.000 | 0.000 | 0.220 | 0.000 | 0.000 | 0.631 | 0.149 | ||
| 2 spectra, AVSTANPLLR | 0.181 | 0.000 | 0.028 | 0.000 | 0.000 | 0.261 | 0.441 | 0.090 |
| Plot | Mito | Lyso or Perox | ER | Golgi | PM | Cytosol | Nucleus | ||||||
| Expt B |
1 peptide |
1 spectrum |
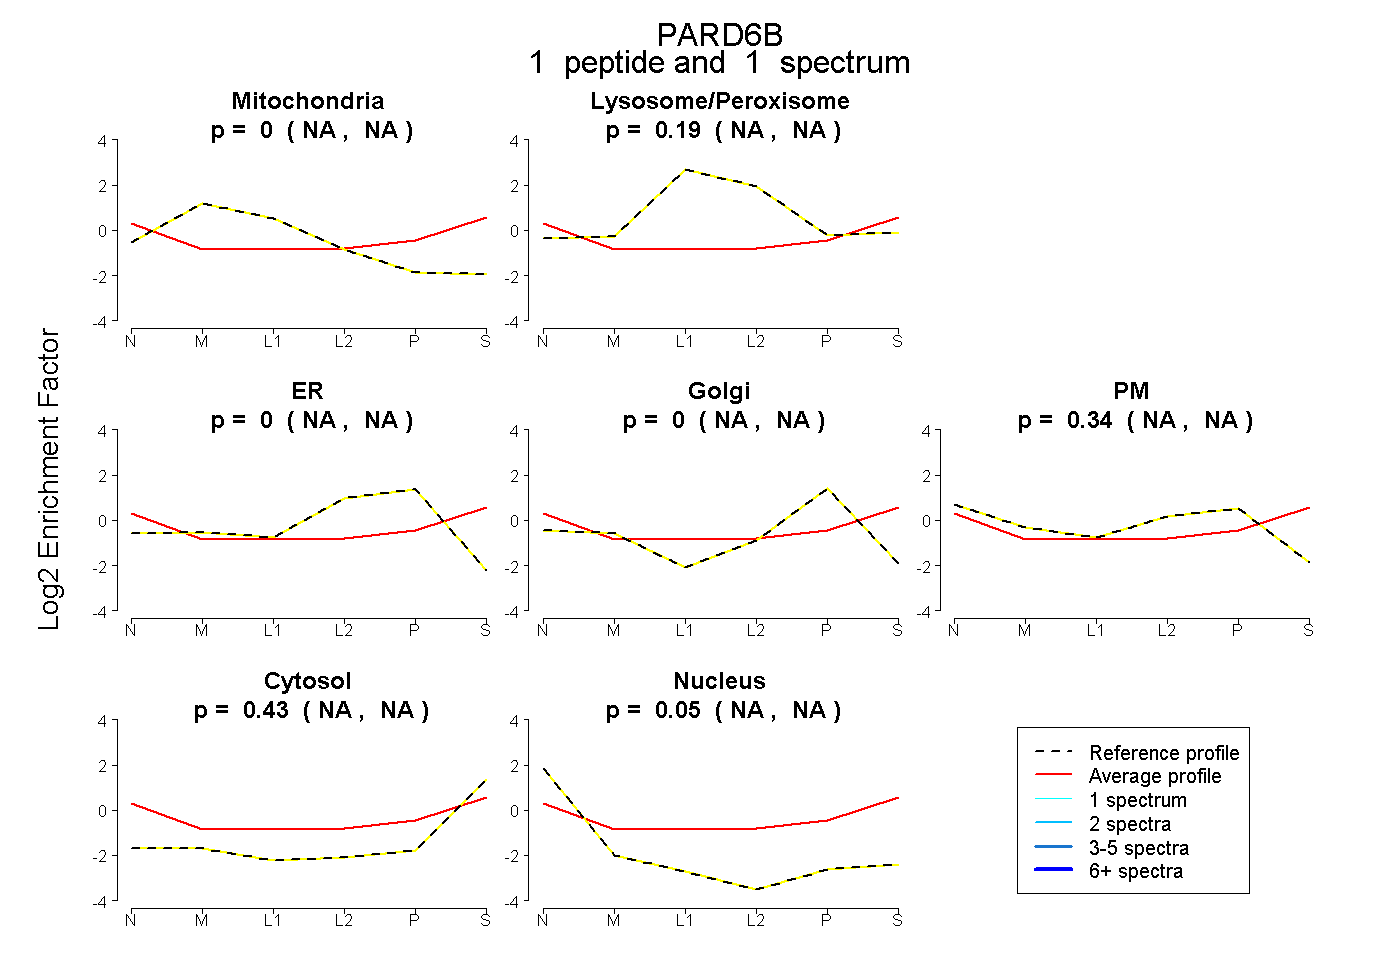 |
0.000 NA | NA |
0.185 NA | NA |
0.000 NA | NA |
0.000 NA | NA |
0.336 NA | NA |
0.433 NA | NA |
0.046 NA | NA |
|||
| Plot | Lyso | Other | |||||||||||
| Expt C |
1 peptide |
4 spectra |
 |
0.000 0.000 | 0.000 |
1.000 1.000 | 1.000 |