 6
6peptides
spectra
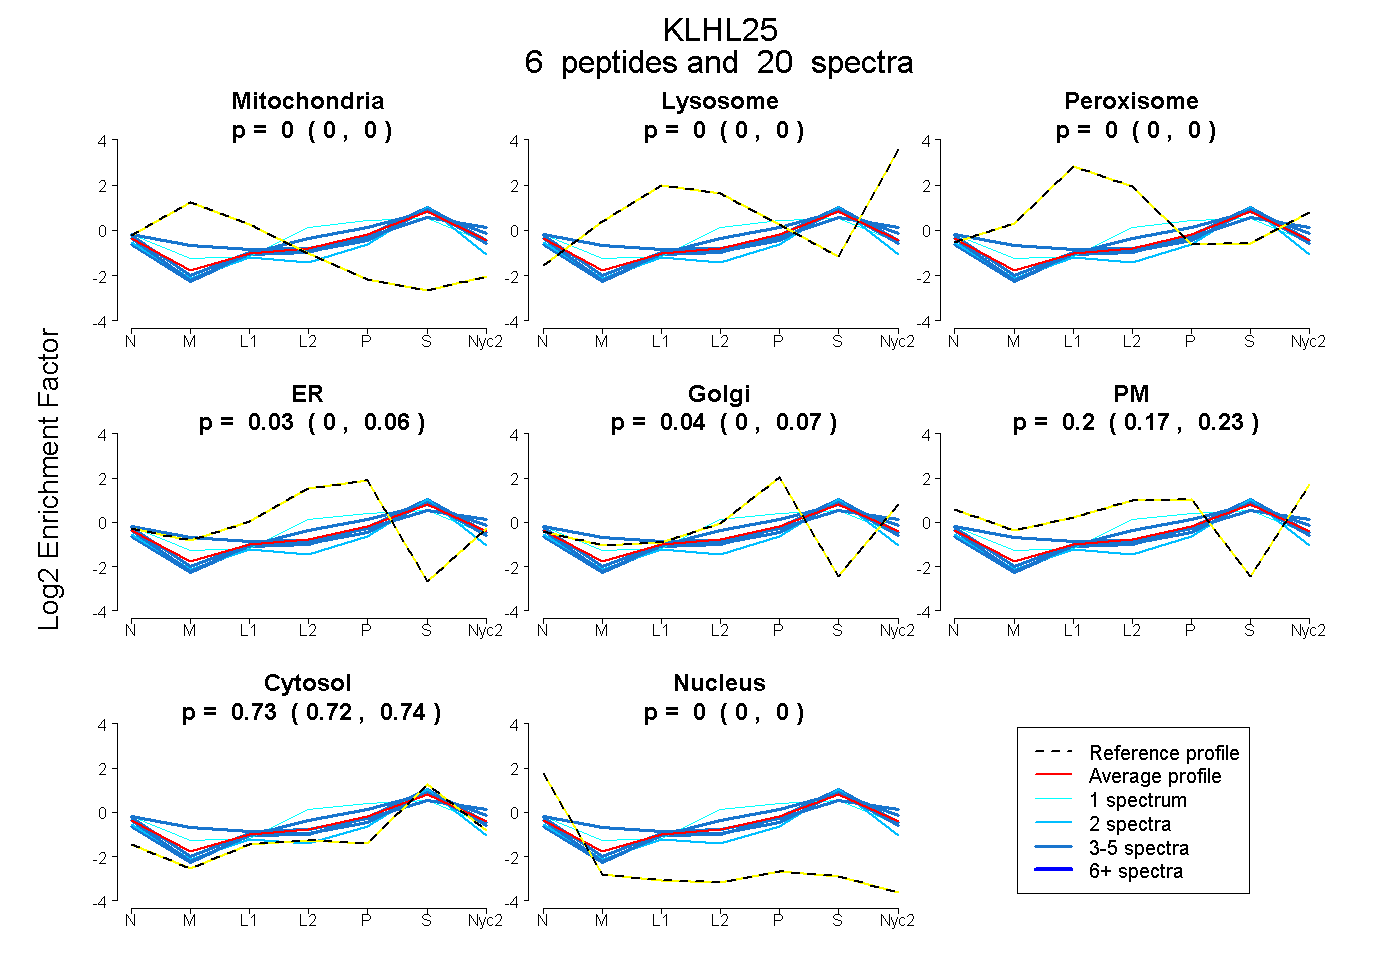
0.000 | 0.000
0.000 | 0.000
0.000 | 0.005
0.000 | 0.061
0.000 | 0.069
0.170 | 0.229
0.717 | 0.738
0.000 | 0.000
2peptides
spectra
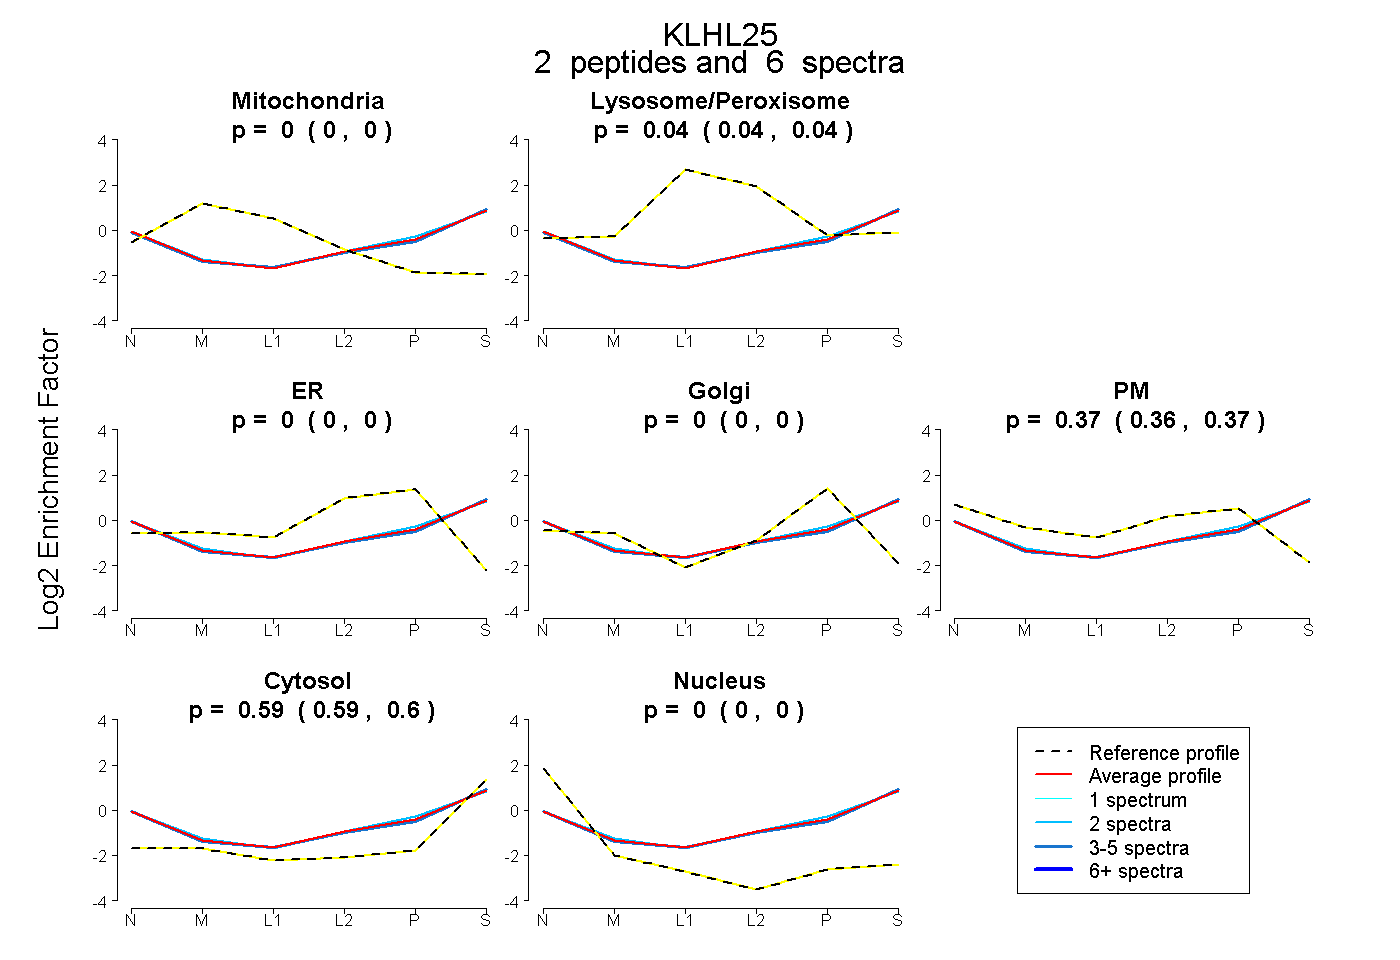
0.000 | 0.000
0.035 | 0.043
0.000 | 0.000
0.000 | 0.000
0.361 | 0.371
0.591 | 0.598
0.000 | 0.000
5peptides
spectra
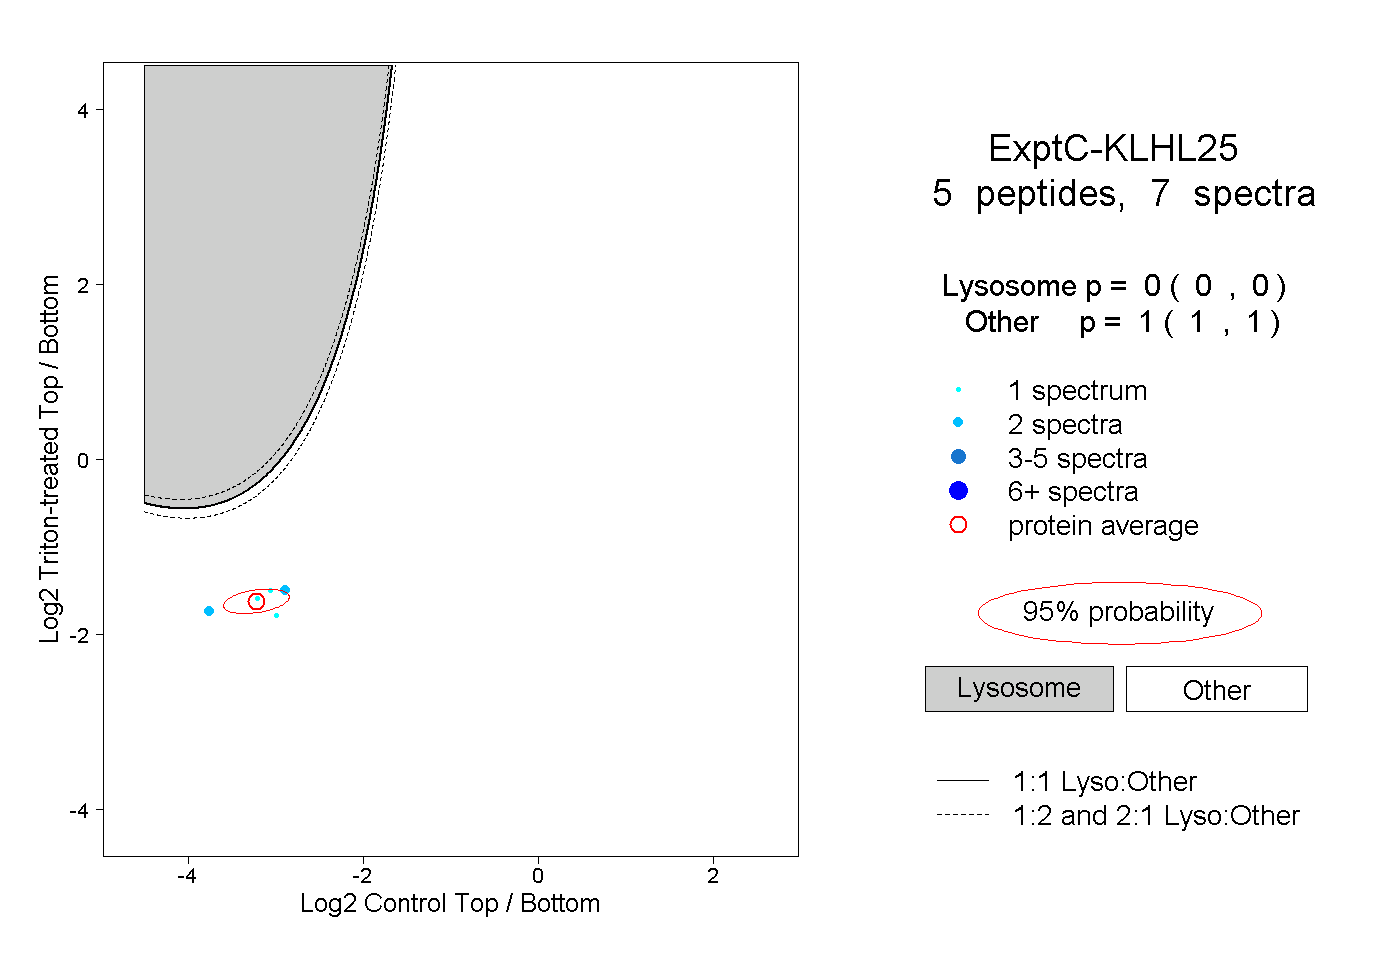
0.000 | 0.000
1.000 | 1.000
3peptides
spectra
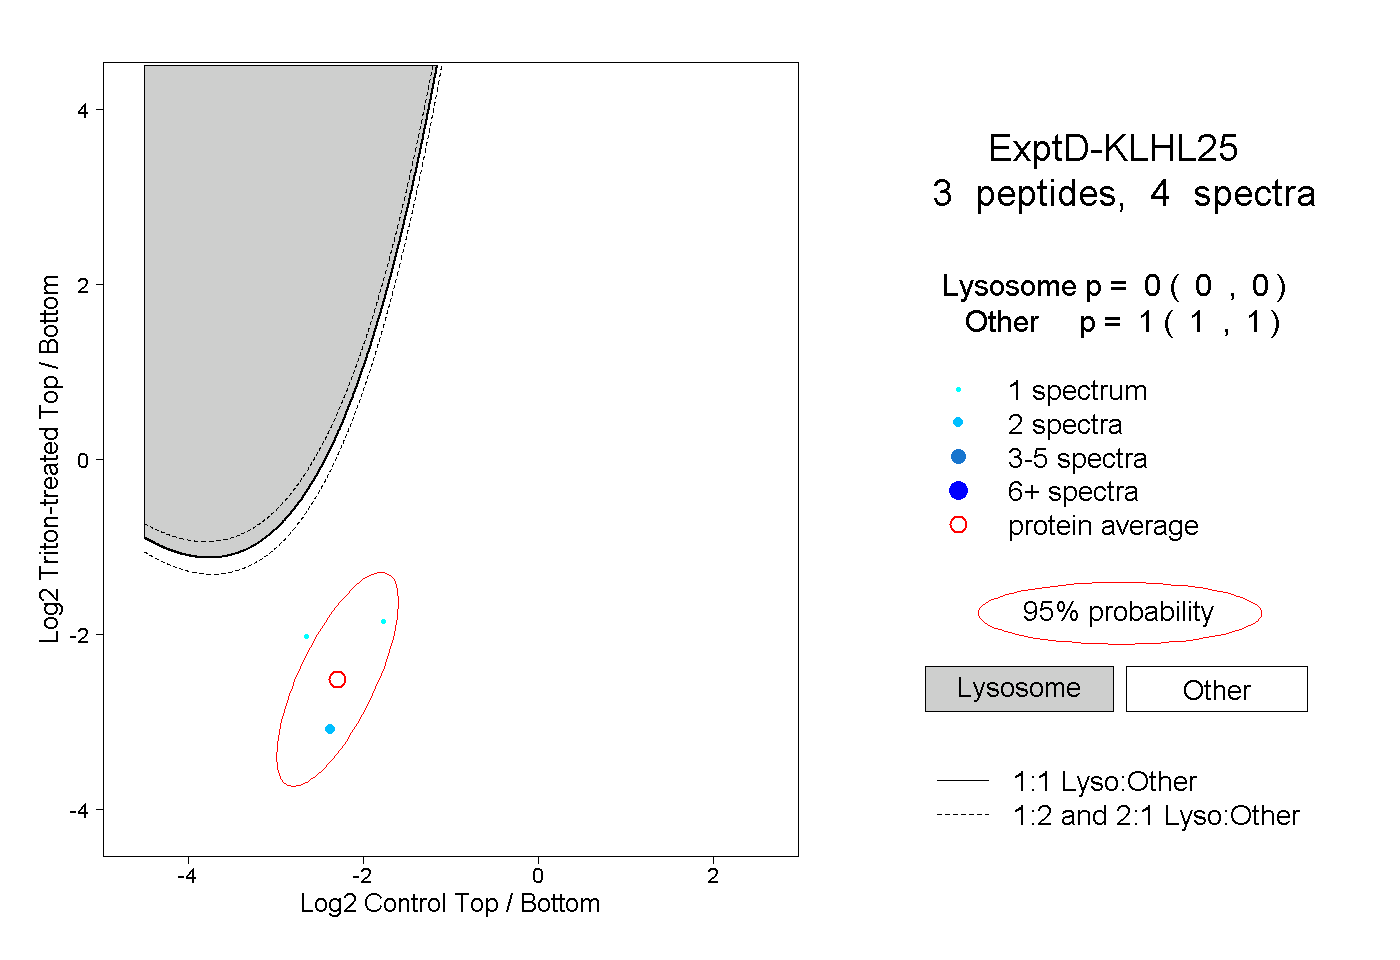
0.000 | 0.000
1.000 | 1.000