 6
6peptides
spectra
0.000 | 0.000
0.000 | 0.000
0.000 | 0.005
0.000 | 0.061
0.000 | 0.069
0.170 | 0.229
0.717 | 0.738
0.000 | 0.000
| Plot | Mito | Lyso | Perox | ER | Golgi | PM | Cytosol | Nucleus | |||||
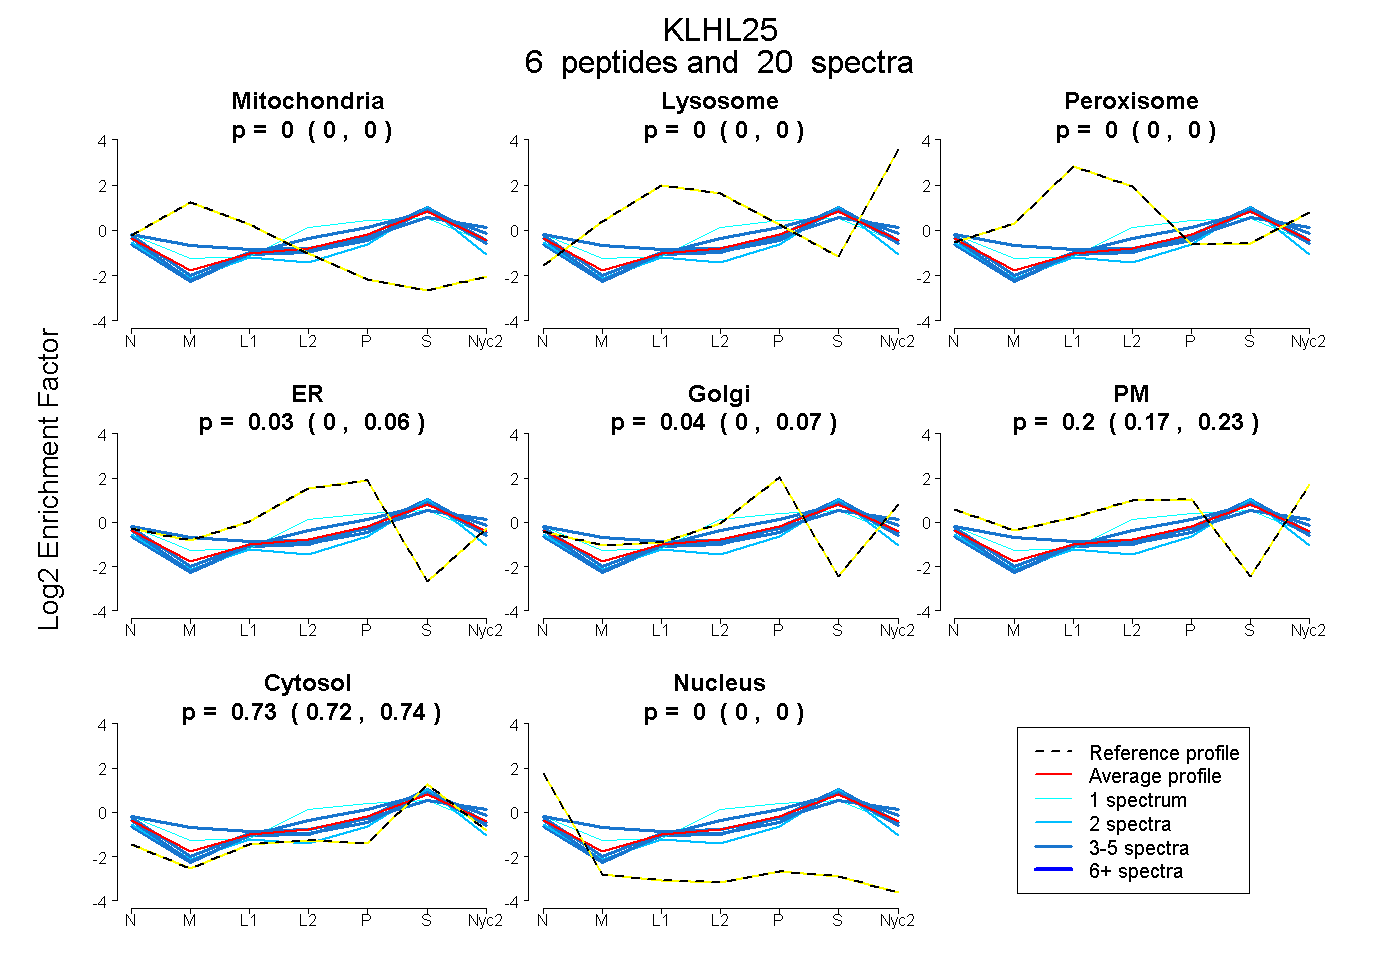
| Expt A |
6 peptides |
20 spectra |
|
0.000 0.000 | 0.000 |
0.000 0.000 | 0.000 |
0.000 0.000 | 0.005 |
0.030 0.000 | 0.061 |
0.036 0.000 | 0.069 |
0.205 0.170 | 0.229 |
0.729 0.717 | 0.738 |
0.000 0.000 | 0.000 |
| 1 spectrum, ASHPDCVLAHLNTLR | 0.000 | 0.000 | 0.000 | 0.310 | 0.000 | 0.109 | 0.581 | 0.000 | ||
| 4 spectra, YFEAMFSHGLR | 0.060 | 0.019 | 0.014 | 0.000 | 0.000 | 0.319 | 0.587 | 0.000 | ||
| 5 spectra, DAAAEFLEK | 0.000 | 0.000 | 0.007 | 0.000 | 0.000 | 0.211 | 0.756 | 0.026 | ||
| 2 spectra, AVLAASSR | 0.000 | 0.000 | 0.031 | 0.000 | 0.104 | 0.000 | 0.798 | 0.068 | ||
| 4 spectra, AAPMLIAR | 0.000 | 0.000 | 0.003 | 0.000 | 0.139 | 0.073 | 0.786 | 0.000 | ||
| 4 spectra, VHLPLLLR | 0.000 | 0.000 | 0.000 | 0.061 | 0.070 | 0.183 | 0.686 | 0.000 |
| Plot | Mito | Lyso or Perox | ER | Golgi | PM | Cytosol | Nucleus | ||||||
| Expt B |
2 peptides |
6 spectra |
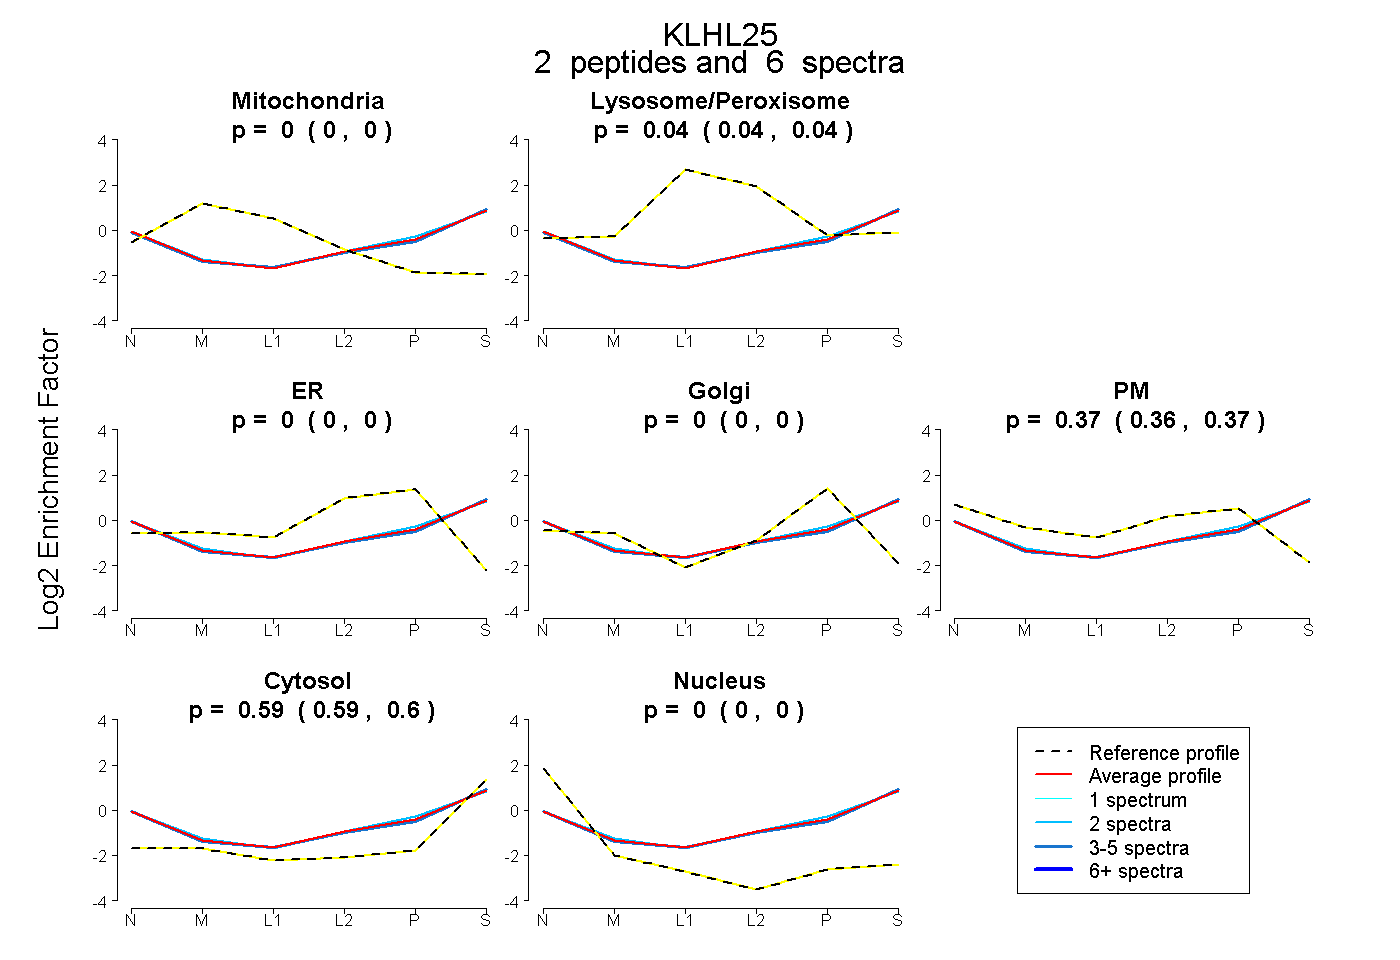 |
0.000 0.000 | 0.000 |
0.039 0.035 | 0.043 |
0.000 0.000 | 0.000 |
0.000 0.000 | 0.000 |
0.366 0.361 | 0.371 |
0.594 0.591 | 0.598 |
0.000 0.000 | 0.000 |
|||
| Plot | Lyso | Other | |||||||||||
| Expt C |
5 peptides |
7 spectra |
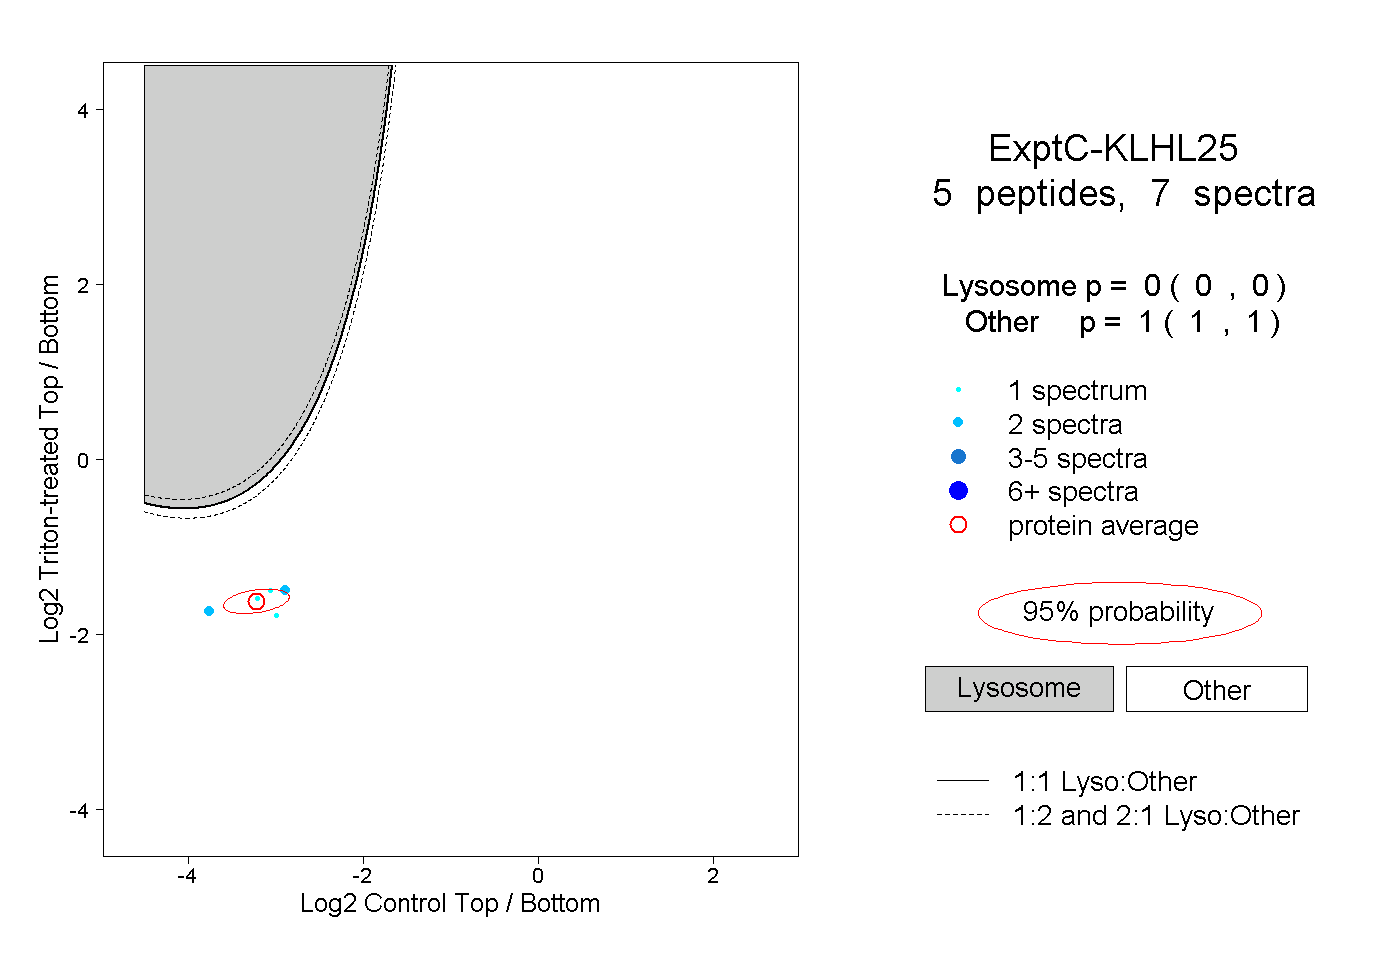 |
0.000 0.000 | 0.000 |
1.000 1.000 | 1.000 |
||||||||
| Plot | Lyso | Other | |||||||||||
| Expt D |
3 peptides |
4 spectra |
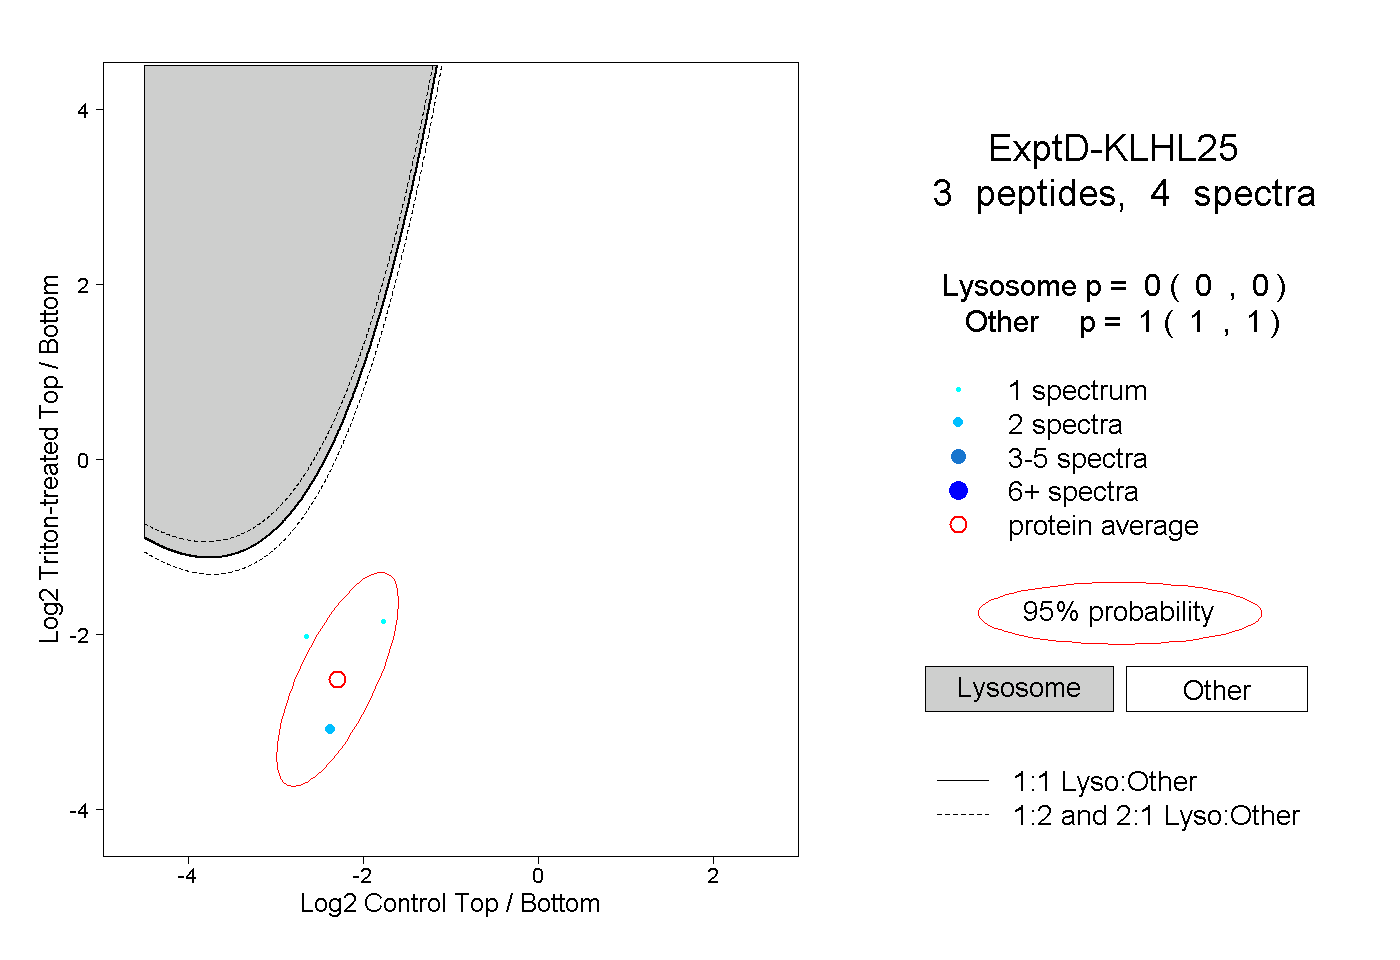 |
0.000 0.000 | 0.000 |
1.000 1.000 | 1.000 |