 10
10peptides
spectra
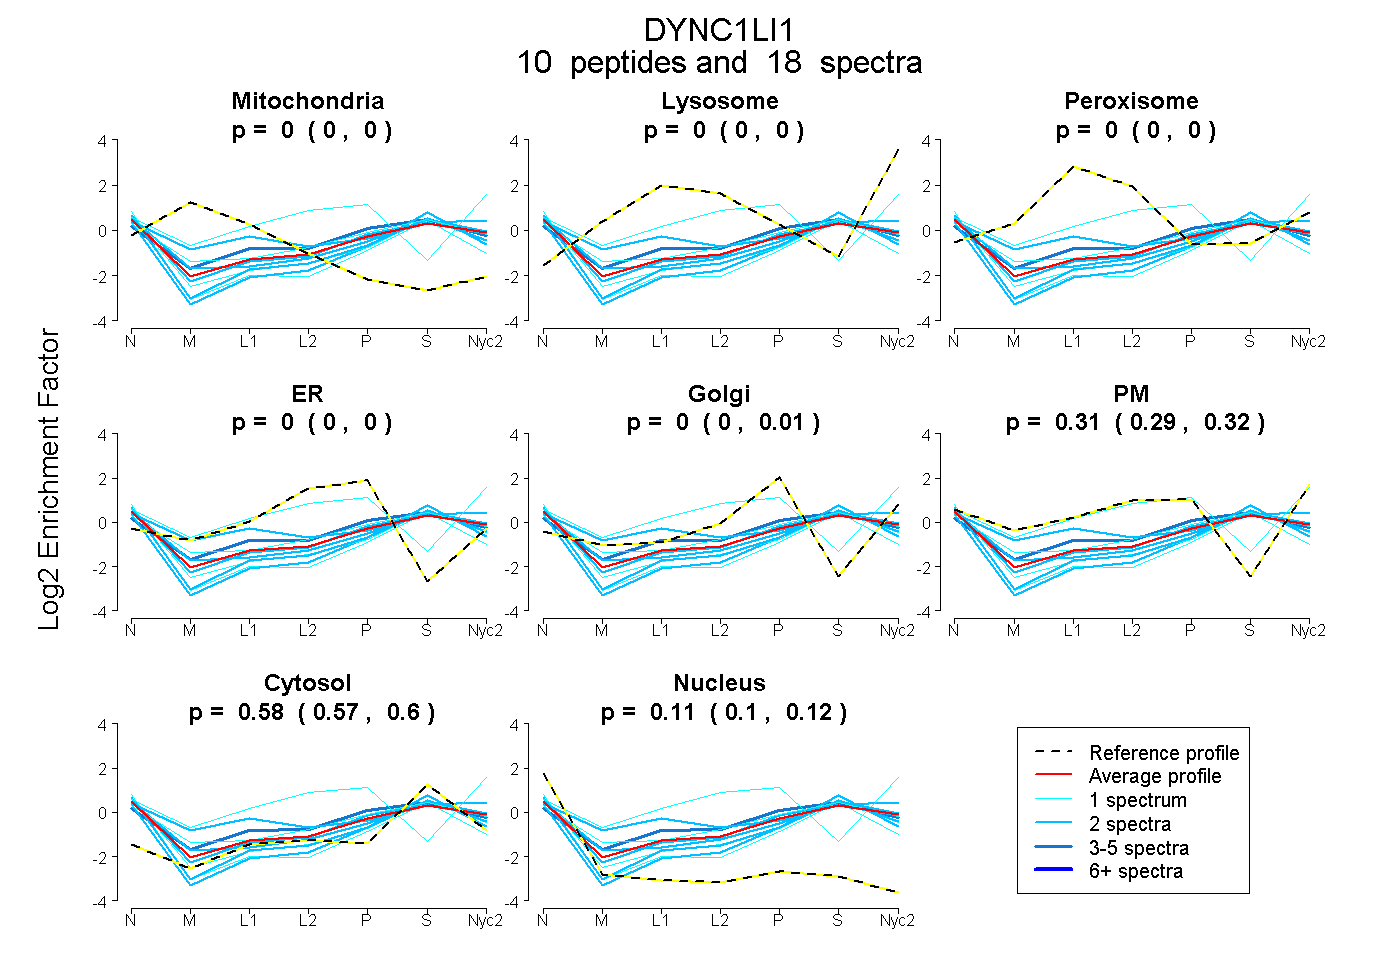
0.000 | 0.000
0.000 | 0.000
0.000 | 0.000
0.000 | 0.000
0.000 | 0.011
0.291 | 0.322
0.566 | 0.595
0.095 | 0.118
2peptides
spectra
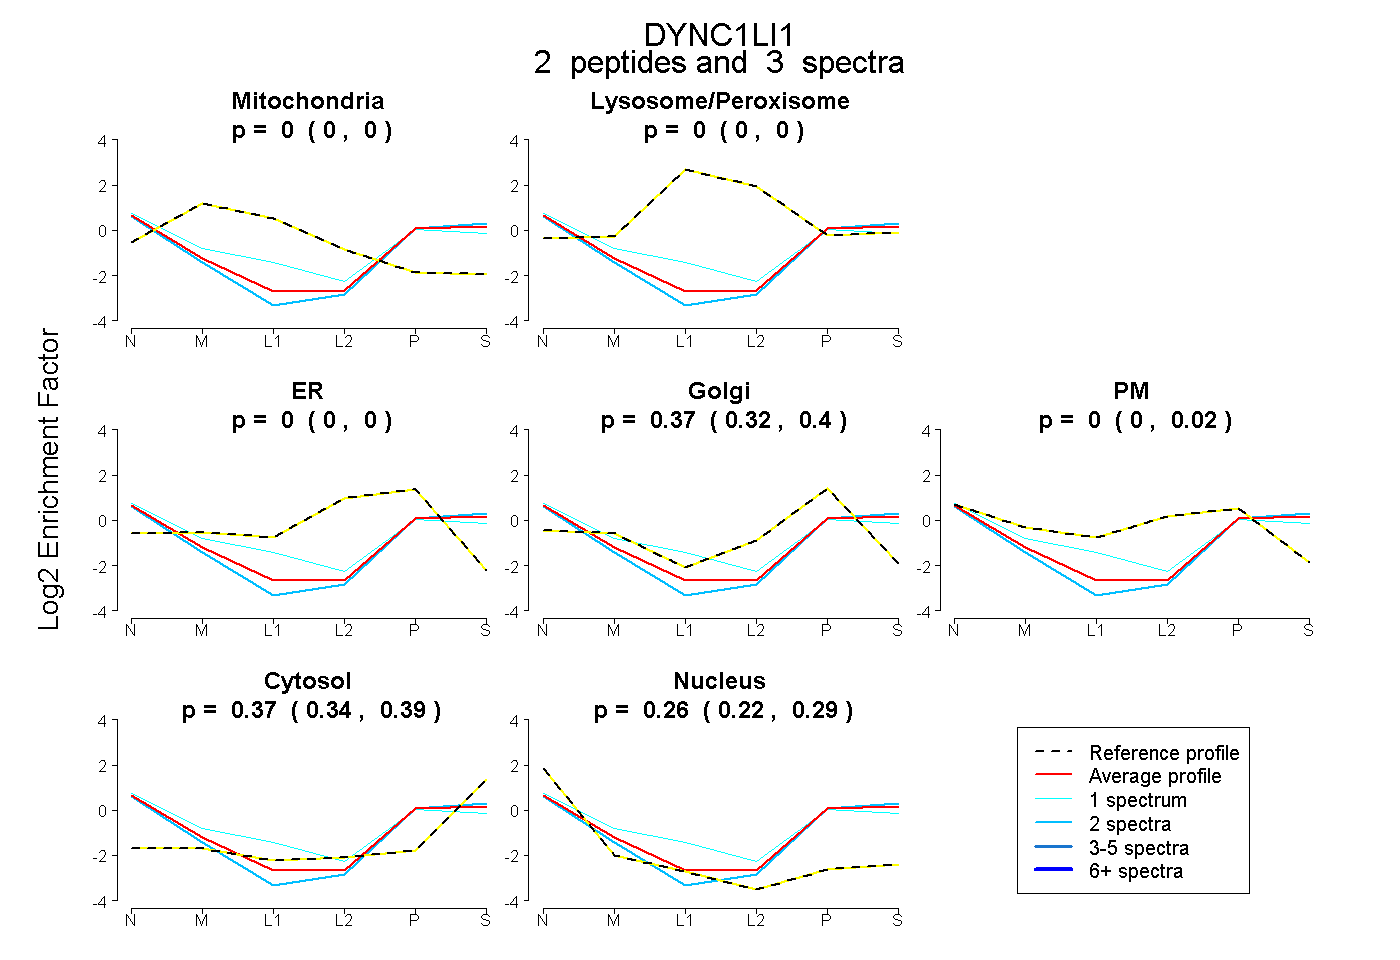
0.000 | 0.000
0.000 | 0.000
0.000 | 0.000
0.321 | 0.398
0.000 | 0.022
0.335 | 0.391
0.224 | 0.288
6peptides
spectra
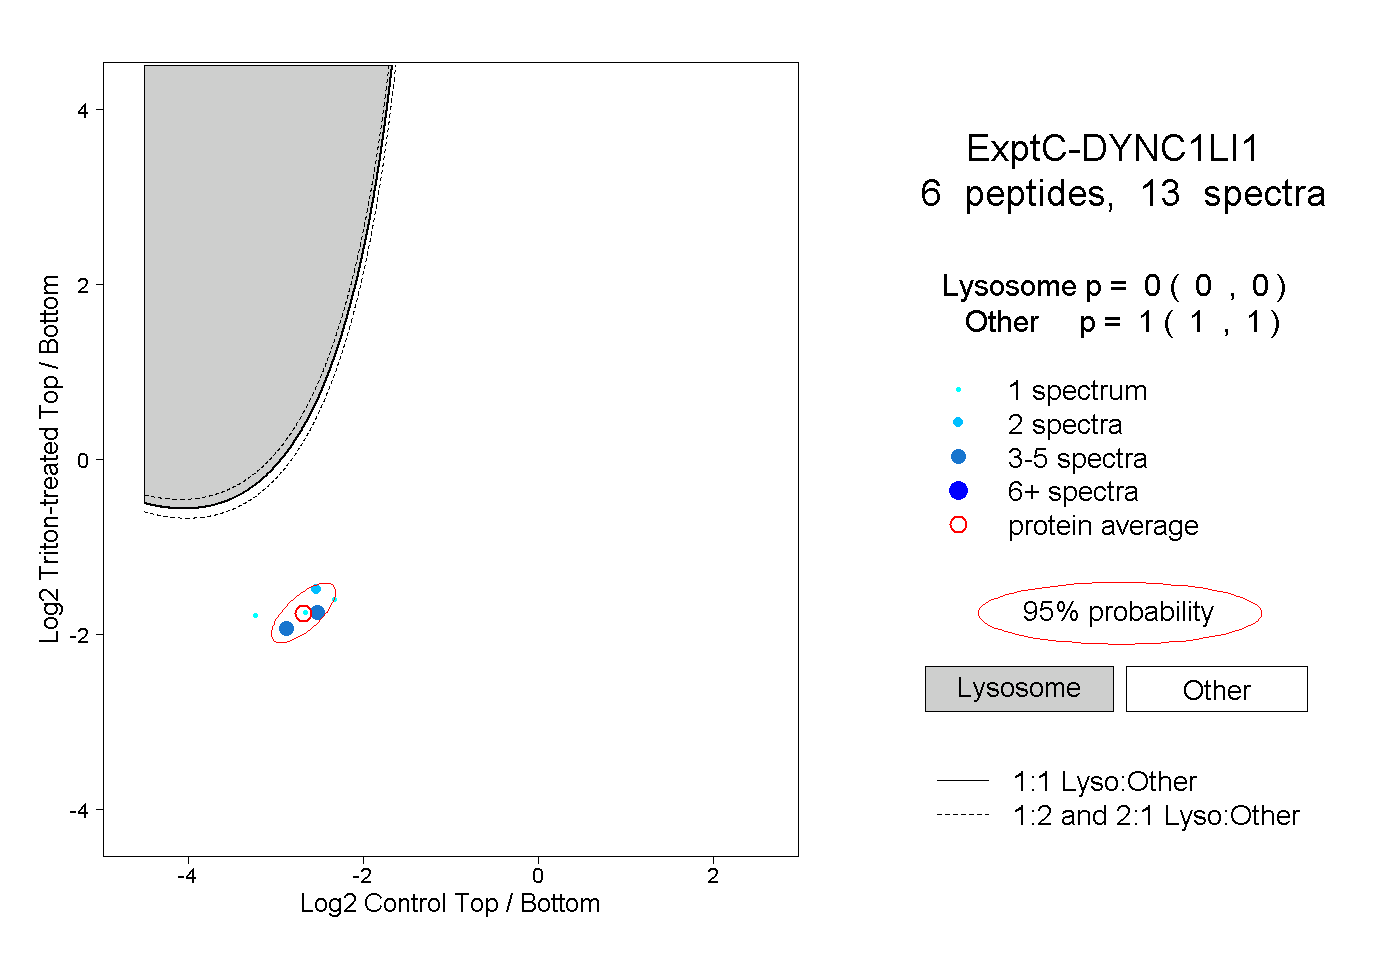
0.000 | 0.000
1.000 | 1.000