 10
10peptides
spectra
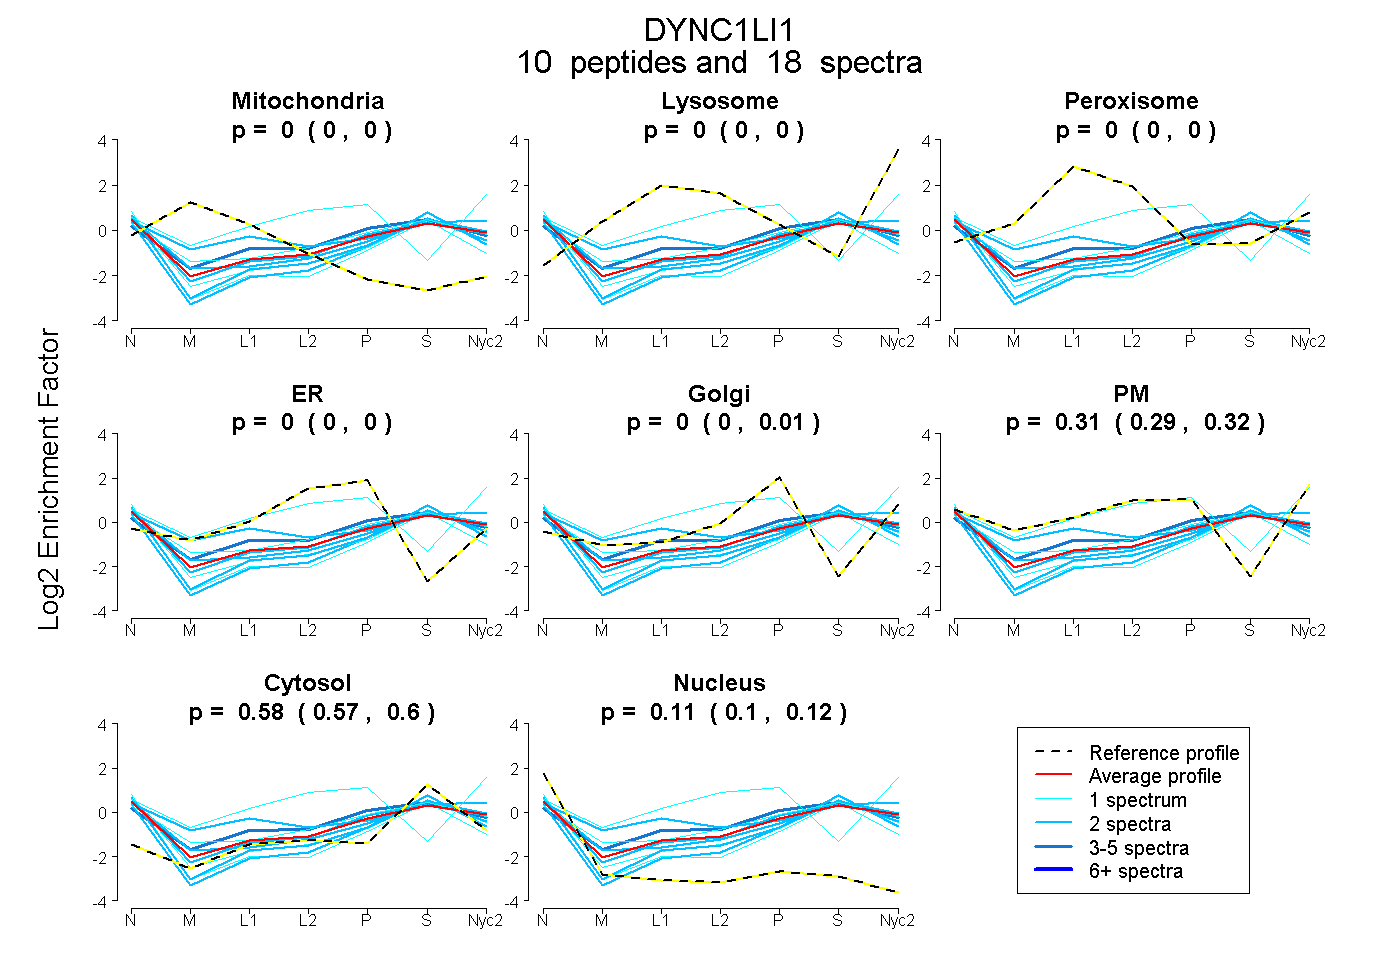
0.000 | 0.000
0.000 | 0.000
0.000 | 0.000
0.000 | 0.000
0.000 | 0.011
0.291 | 0.322
0.566 | 0.595
0.095 | 0.118
| Plot | Mito | Lyso | Perox | ER | Golgi | PM | Cytosol | Nucleus | |||||
| Expt A |
10 peptides |
18 spectra |
|
0.000 0.000 | 0.000 |
0.000 0.000 | 0.000 |
0.000 0.000 | 0.000 |
0.000 0.000 | 0.000 |
0.000 0.000 | 0.011 |
0.310 0.291 | 0.322 |
0.583 0.566 | 0.595 |
0.107 0.095 | 0.118 |
| 2 spectra, LYGFPYK | 0.000 | 0.000 | 0.000 | 0.000 | 0.000 | 0.284 | 0.601 | 0.115 | ||
| 4 spectra, EIMAEDDQVFLMK | 0.000 | 0.000 | 0.000 | 0.000 | 0.042 | 0.321 | 0.609 | 0.027 | ||
| 2 spectra, QPPTAAGRPVDASPR | 0.030 | 0.000 | 0.168 | 0.000 | 0.000 | 0.268 | 0.466 | 0.068 | ||
| 1 spectrum, IEDNFEDIITKPPVR | 0.000 | 0.000 | 0.000 | 0.000 | 0.000 | 0.183 | 0.633 | 0.184 | ||
| 1 spectrum, DFQEYVEPGEDFPASPQR | 0.000 | 0.000 | 0.000 | 0.000 | 0.046 | 0.040 | 0.624 | 0.289 | ||
| 2 spectra, IGILHENFQTLK | 0.000 | 0.000 | 0.000 | 0.000 | 0.000 | 0.164 | 0.652 | 0.184 | ||
| 1 spectrum, NIDLVYK | 0.000 | 0.000 | 0.000 | 0.000 | 0.000 | 0.353 | 0.594 | 0.052 | ||
| 1 spectrum, LDPDMK | 0.000 | 0.037 | 0.025 | 0.000 | 0.000 | 0.820 | 0.119 | 0.000 | ||
| 2 spectra, FSLDALSLR | 0.000 | 0.000 | 0.000 | 0.000 | 0.092 | 0.000 | 0.724 | 0.183 | ||
| 2 spectra, ATAAQEDR | 0.000 | 0.000 | 0.000 | 0.000 | 0.000 | 0.337 | 0.585 | 0.078 |
| Plot | Mito | Lyso or Perox | ER | Golgi | PM | Cytosol | Nucleus | ||||||
| Expt B |
2 peptides |
3 spectra |
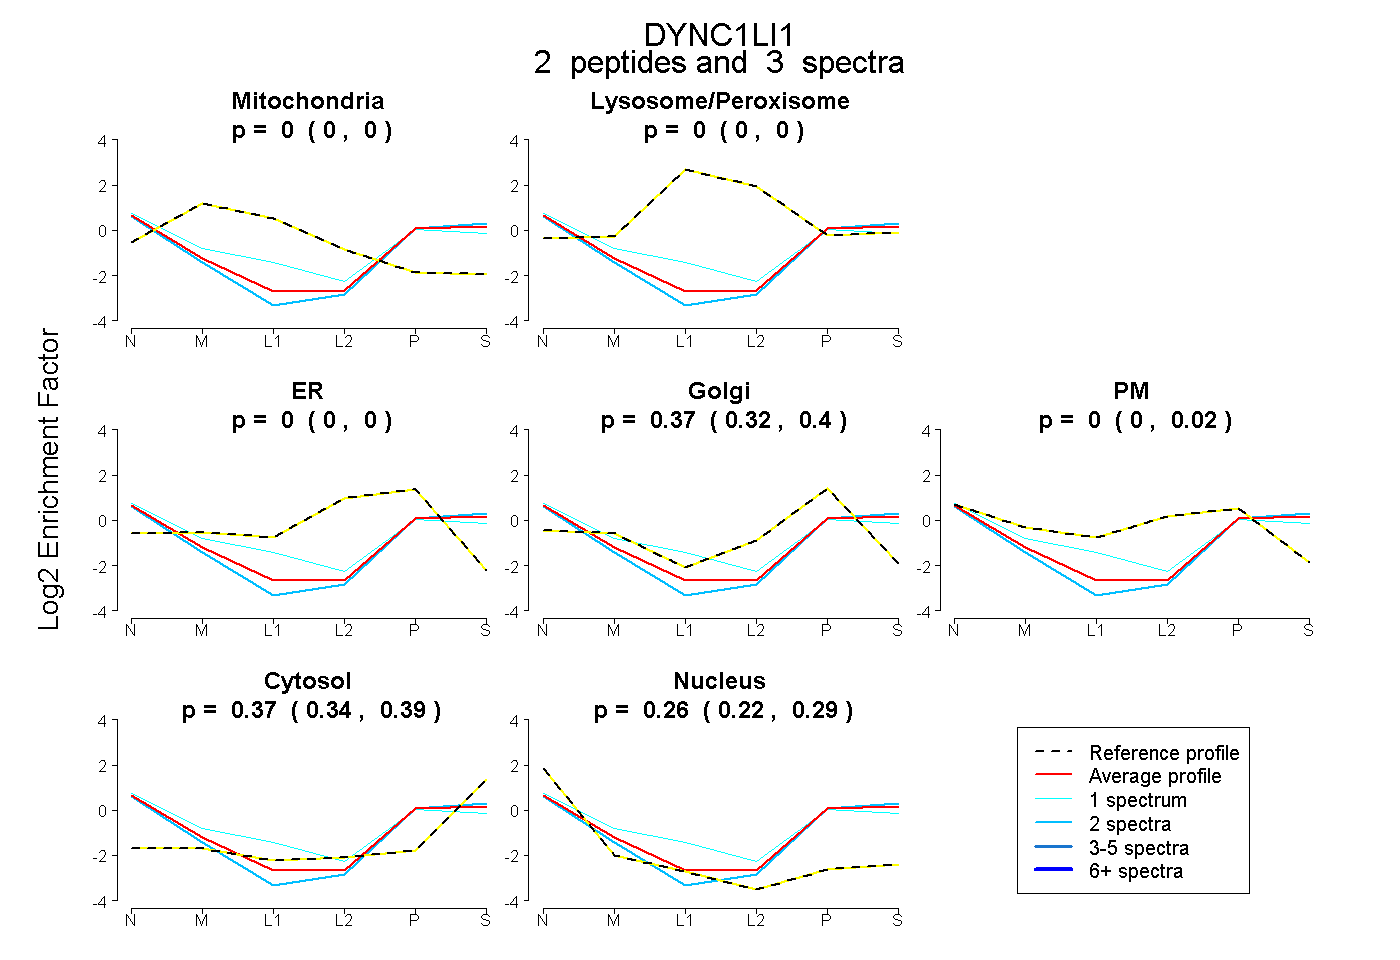 |
0.000 0.000 | 0.000 |
0.000 0.000 | 0.000 |
0.000 0.000 | 0.000 |
0.373 0.321 | 0.398 |
0.000 0.000 | 0.022 |
0.366 0.335 | 0.391 |
0.261 0.224 | 0.288 |
|||
| Plot | Lyso | Other | |||||||||||
| Expt C |
6 peptides |
13 spectra |
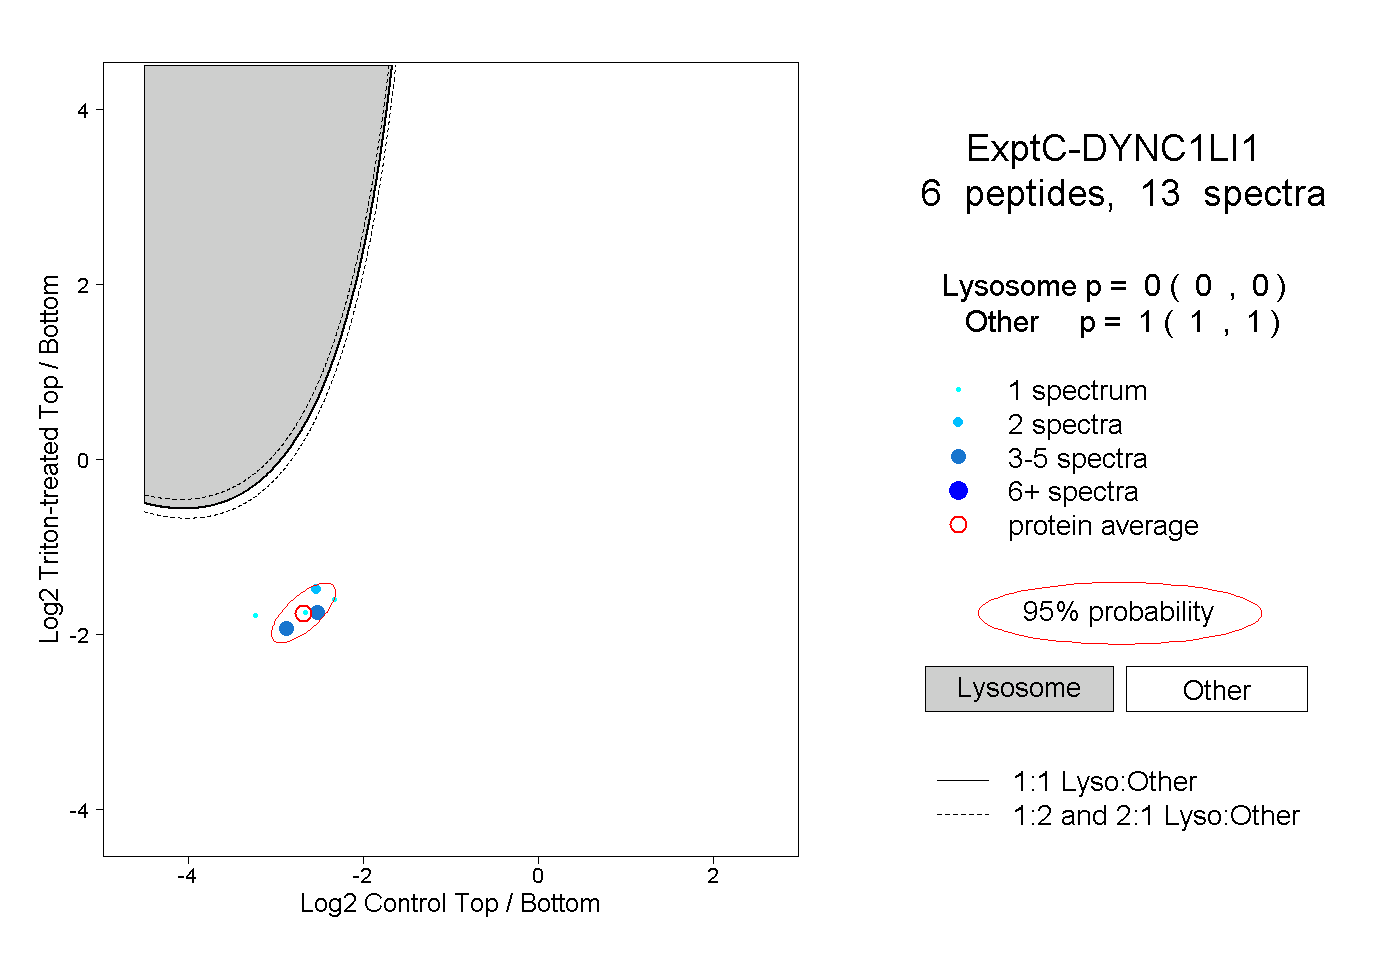 |
0.000 0.000 | 0.000 |
1.000 1.000 | 1.000 |