 10
10peptides
spectra
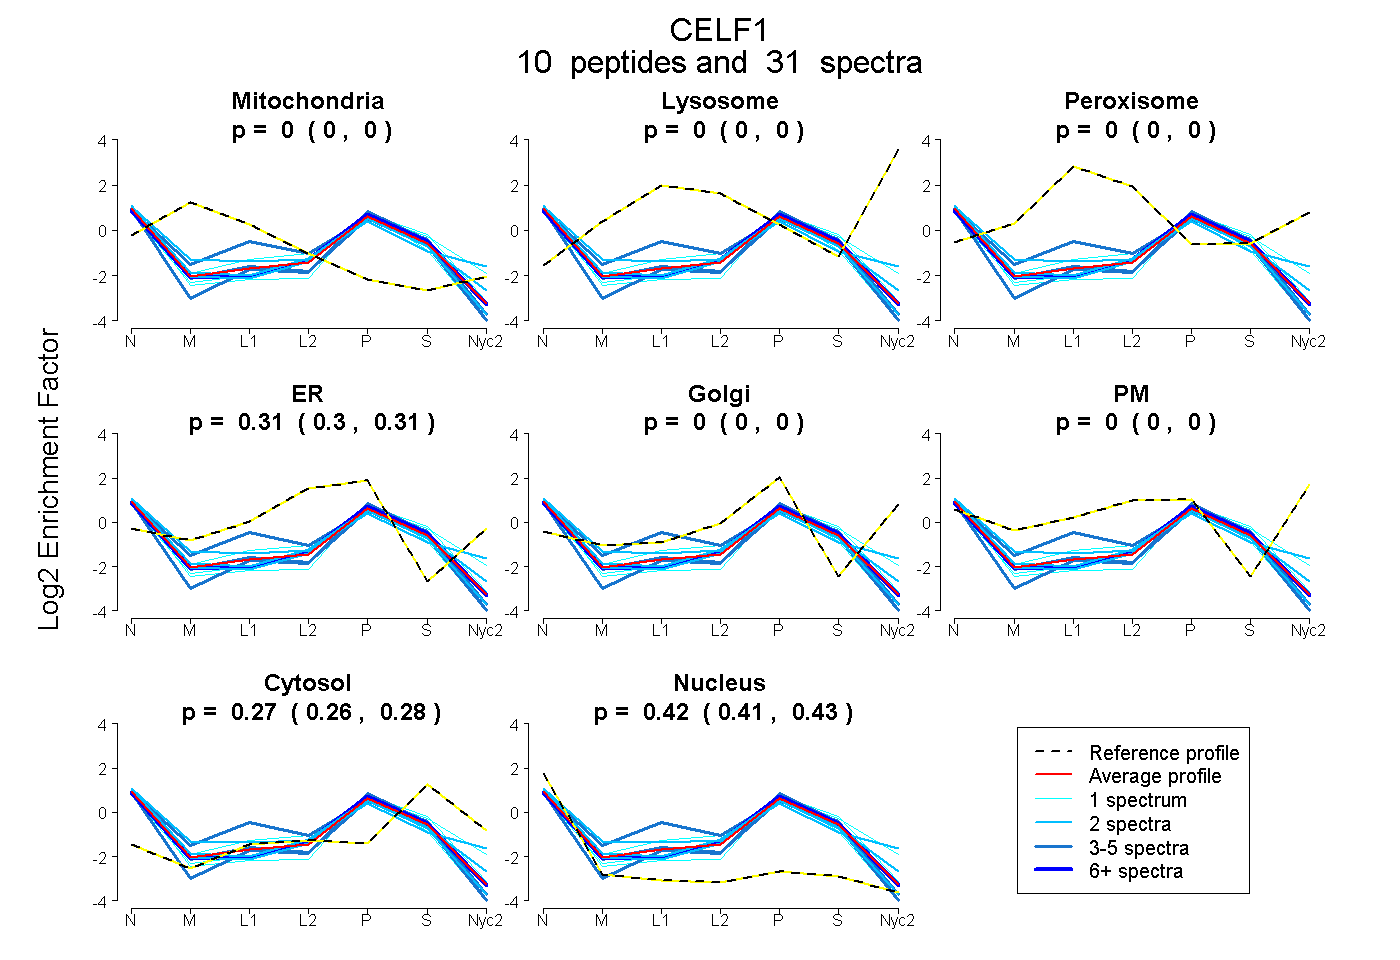
0.000 | 0.000
0.000 | 0.000
0.000 | 0.000
0.304 | 0.314
0.000 | 0.000
0.000 | 0.000
0.264 | 0.275
0.413 | 0.427
3peptides
spectra
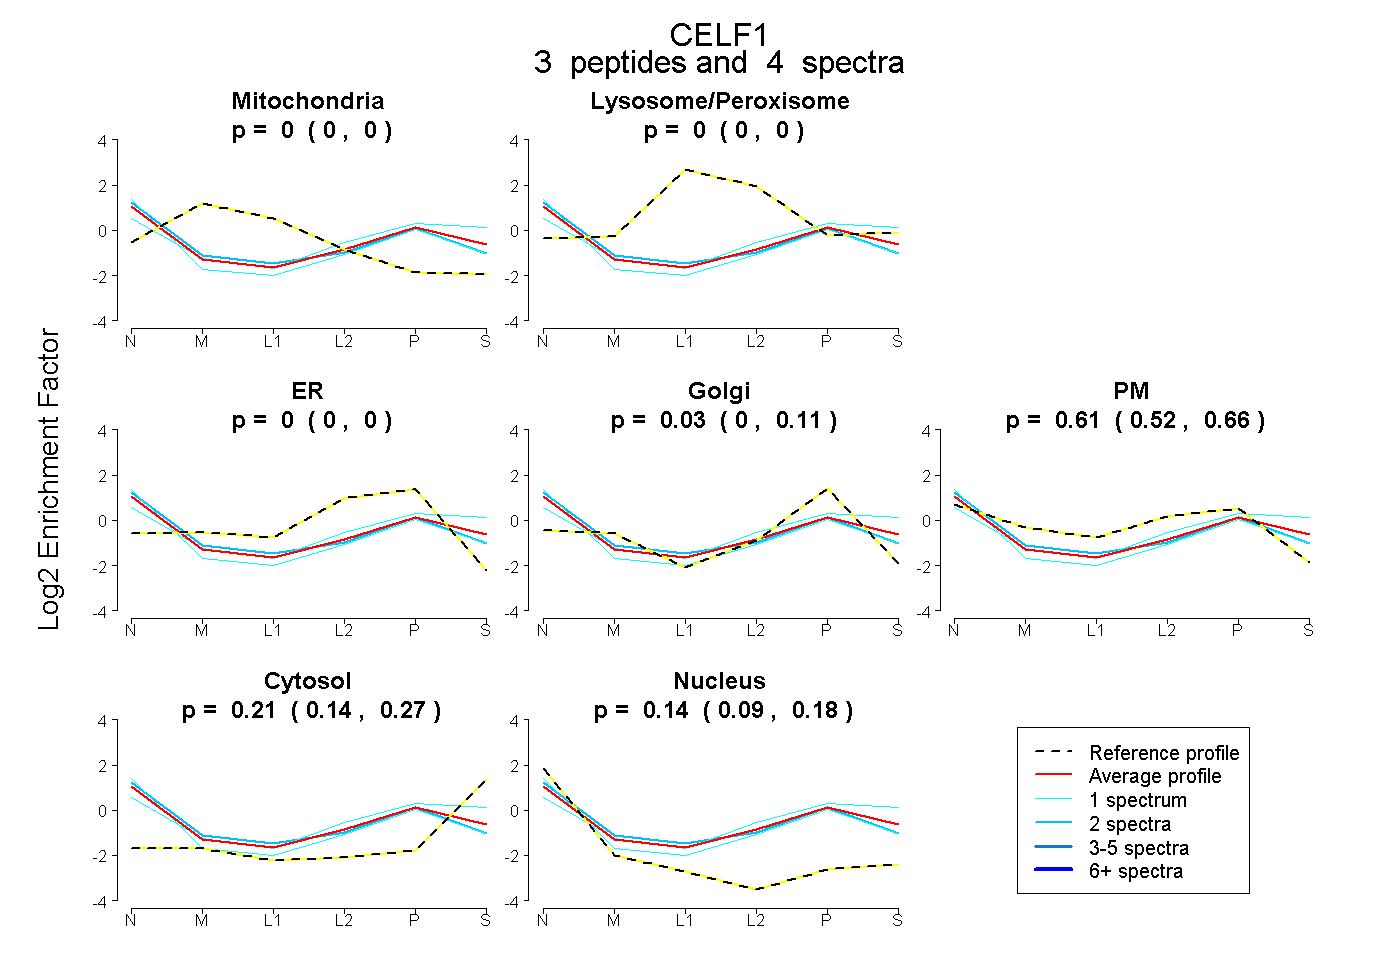
0.000 | 0.000
0.000 | 0.000
0.000 | 0.000
0.000 | 0.114
0.518 | 0.661
0.138 | 0.271
0.093 | 0.185
5peptides
spectra
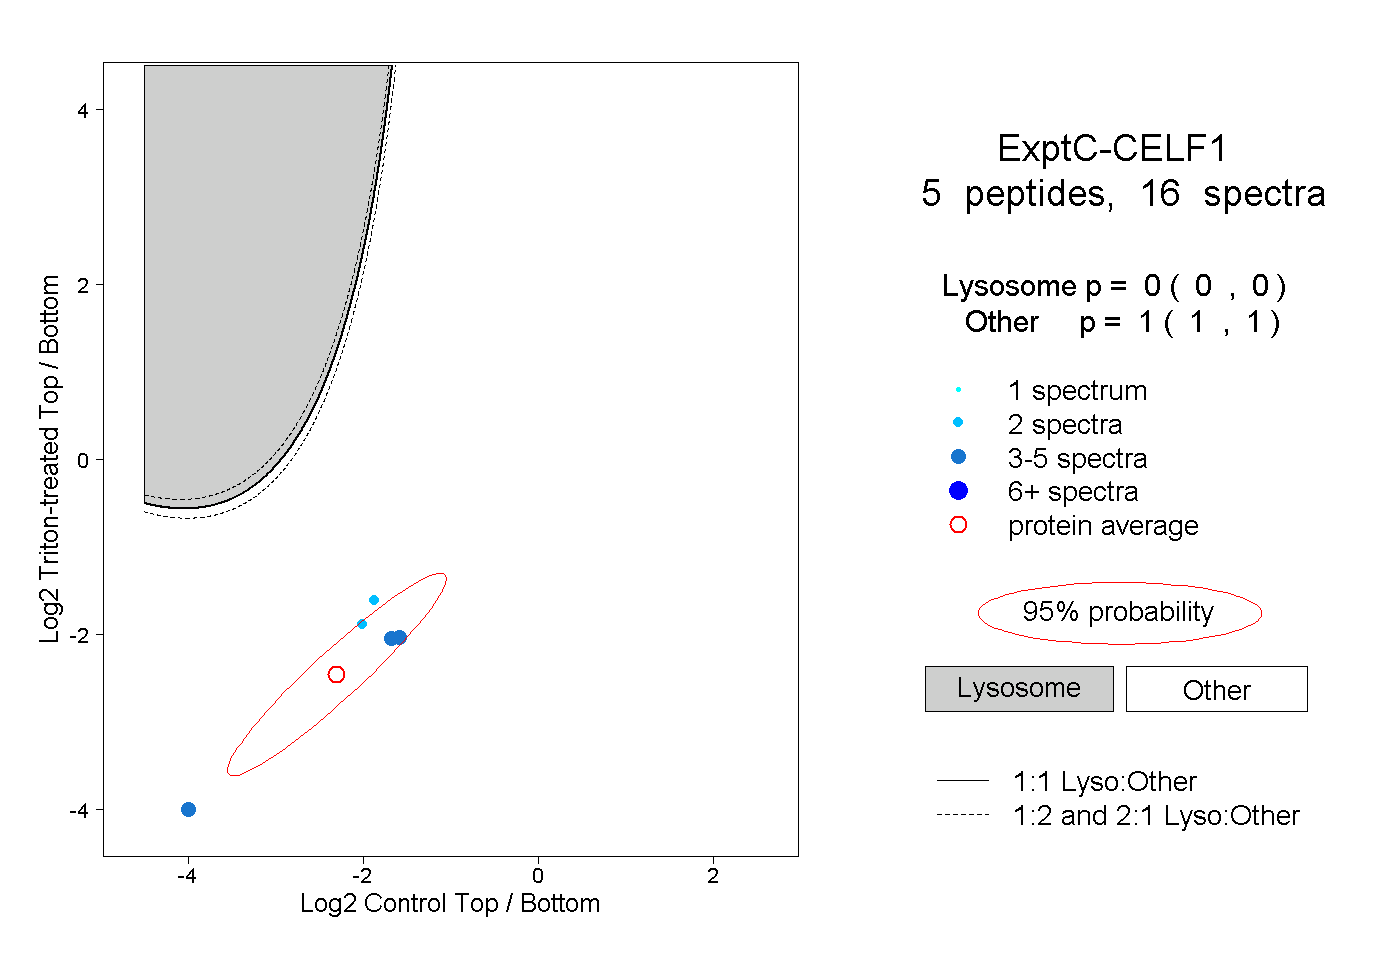
0.000 | 0.000
1.000 | 1.000
1peptide
spectra
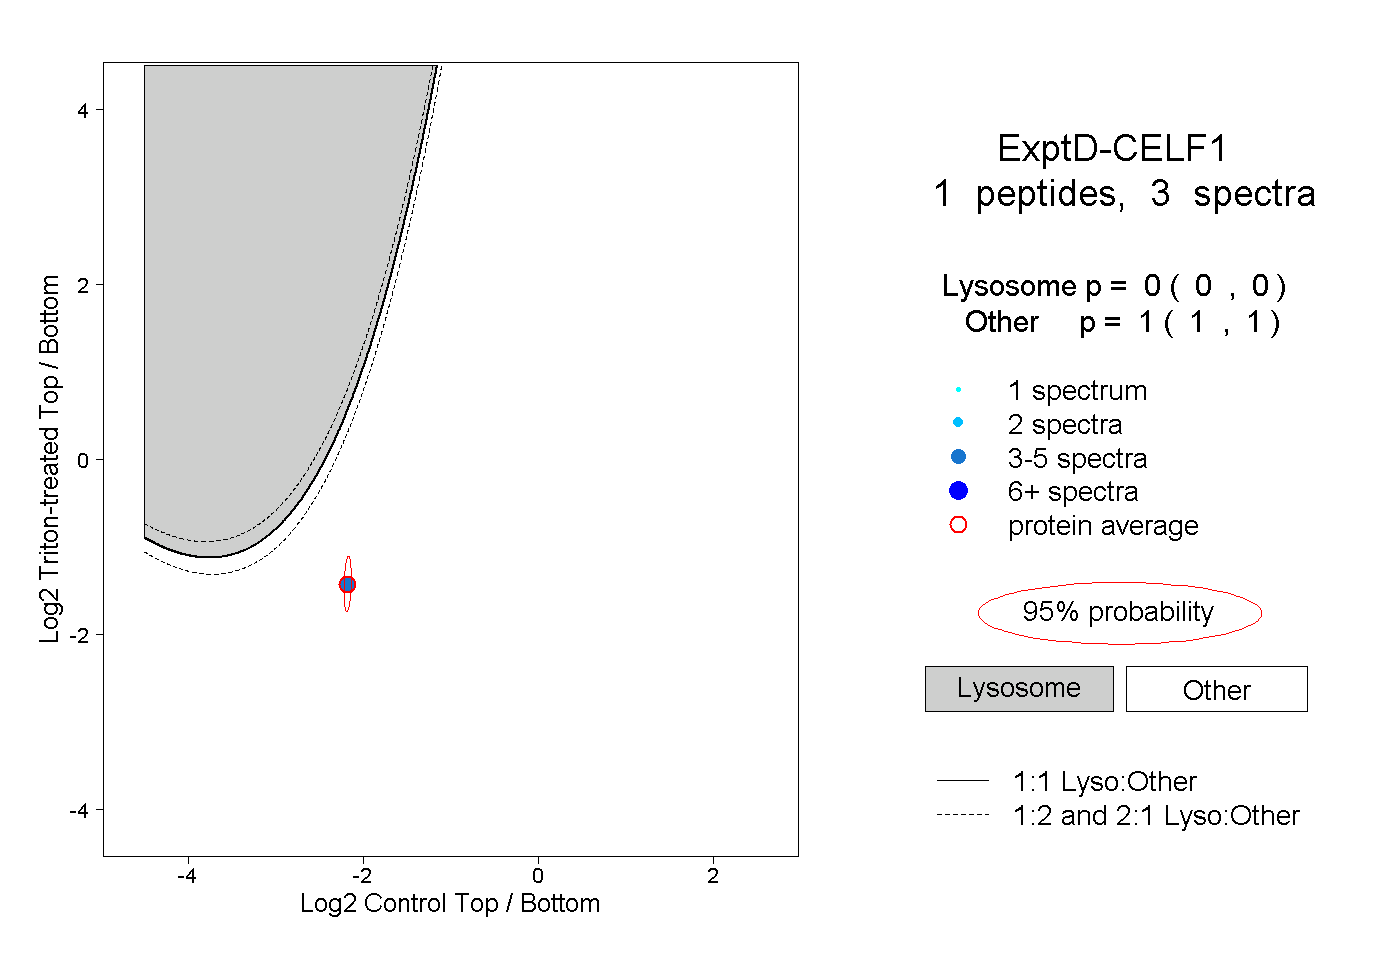
0.000 | 0.000
1.000 | 1.000