 10
10peptides
spectra
0.000 | 0.000
0.000 | 0.000
0.000 | 0.000
0.304 | 0.314
0.000 | 0.000
0.000 | 0.000
0.264 | 0.275
0.413 | 0.427
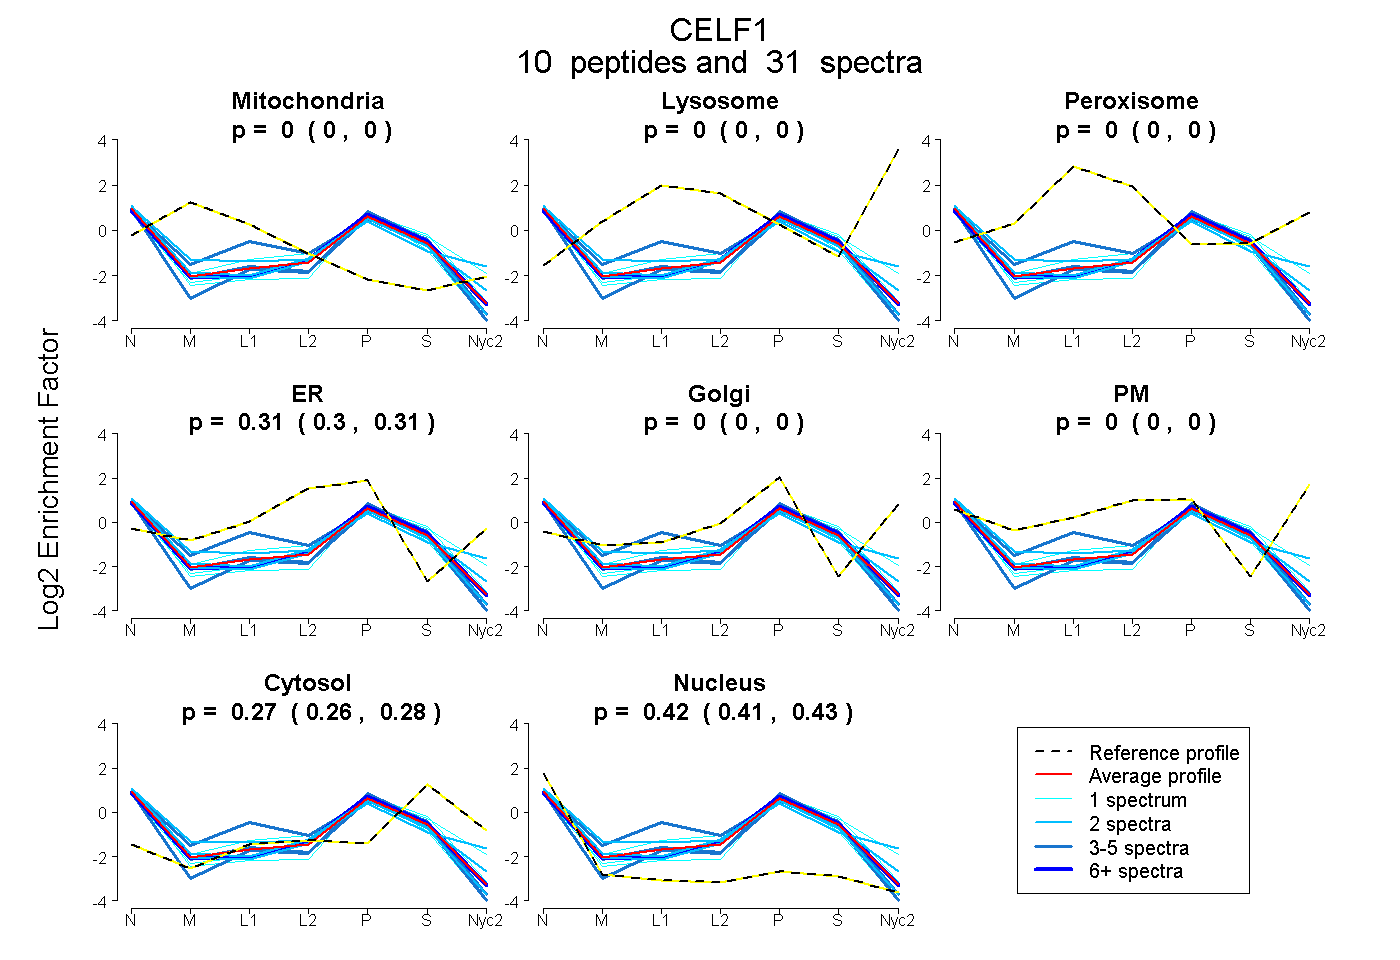
| Plot | Mito | Lyso | Perox | ER | Golgi | PM | Cytosol | Nucleus | |||||
| Expt A |
10 peptides |
31 spectra |
|
0.000 0.000 | 0.000 |
0.000 0.000 | 0.000 |
0.000 0.000 | 0.000 |
0.310 0.304 | 0.314 |
0.000 0.000 | 0.000 |
0.000 0.000 | 0.000 |
0.270 0.264 | 0.275 |
0.420 0.413 | 0.427 |
| 4 spectra, LFIGMISK | 0.000 | 0.000 | 0.000 | 0.232 | 0.000 | 0.000 | 0.303 | 0.465 | ||
| 1 spectrum, AALEAQNALHNMK | 0.000 | 0.000 | 0.000 | 0.347 | 0.027 | 0.000 | 0.376 | 0.251 | ||
| 2 spectra, NNAVEDR | 0.000 | 0.000 | 0.000 | 0.291 | 0.000 | 0.000 | 0.213 | 0.496 | ||
| 4 spectra, GCCFVTFYTR | 0.000 | 0.000 | 0.000 | 0.240 | 0.000 | 0.000 | 0.279 | 0.481 | ||
| 1 spectrum, FADTQK | 0.000 | 0.000 | 0.000 | 0.267 | 0.000 | 0.000 | 0.359 | 0.374 | ||
| 4 spectra, GCAFVTFTTR | 0.058 | 0.000 | 0.000 | 0.370 | 0.000 | 0.000 | 0.195 | 0.376 | ||
| 2 spectra, VMFSSFGQIEECR | 0.000 | 0.000 | 0.032 | 0.171 | 0.259 | 0.000 | 0.206 | 0.331 | ||
| 1 spectrum, ELFEQYGAVYEINILR | 0.000 | 0.000 | 0.000 | 0.248 | 0.000 | 0.000 | 0.193 | 0.559 | ||
| 10 spectra, MFVGQVPR | 0.000 | 0.000 | 0.000 | 0.301 | 0.000 | 0.000 | 0.281 | 0.418 | ||
| 2 spectra, SQNPPQSK | 0.000 | 0.000 | 0.000 | 0.342 | 0.000 | 0.000 | 0.260 | 0.398 |
| Plot | Mito | Lyso or Perox | ER | Golgi | PM | Cytosol | Nucleus | ||||||
| Expt B |
3 peptides |
4 spectra |
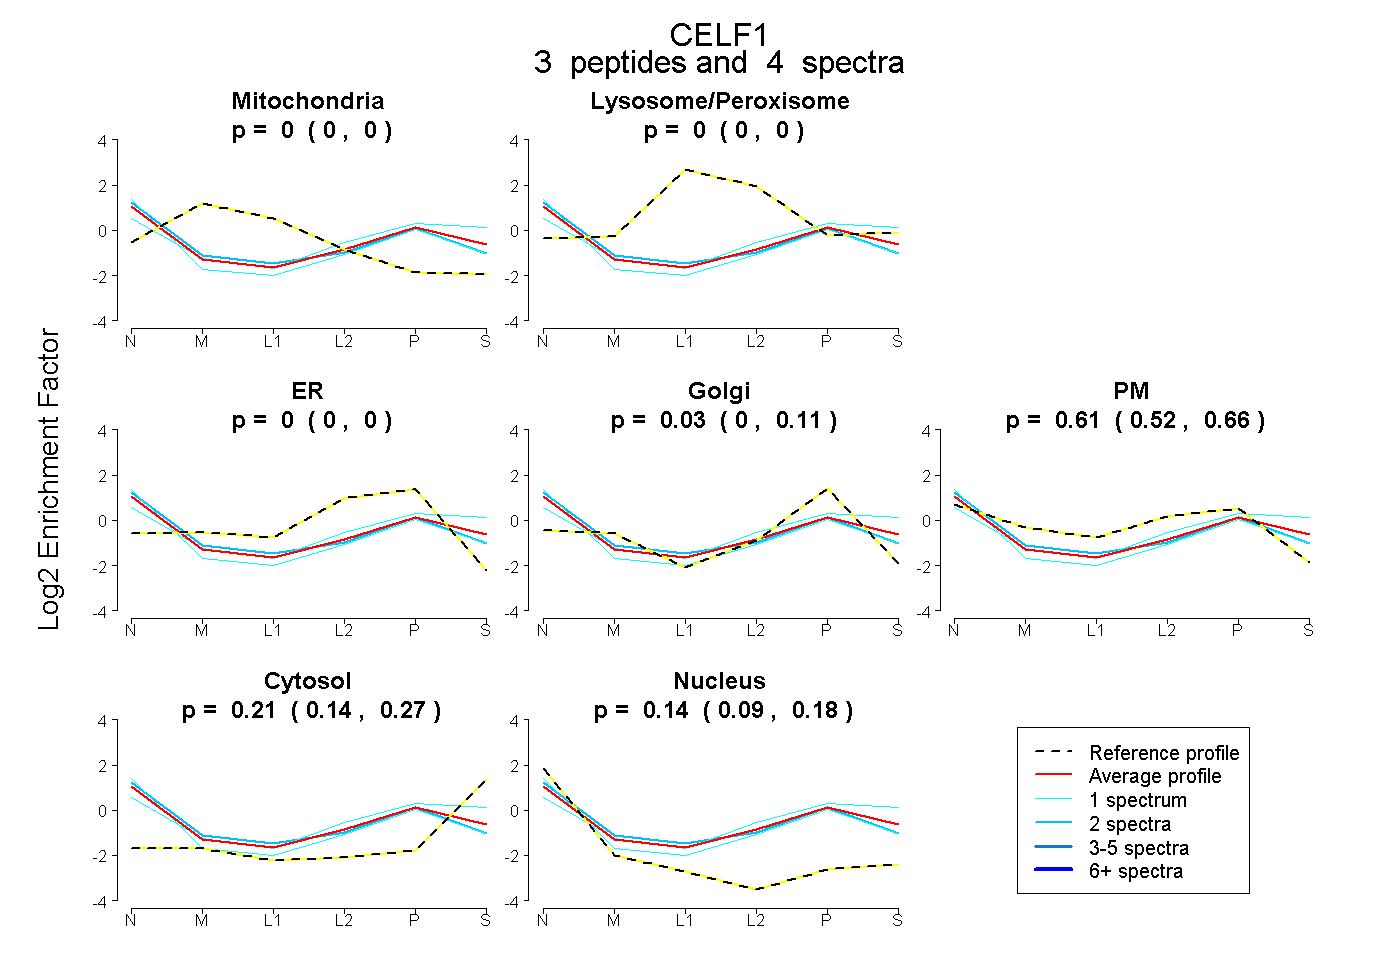 |
0.000 0.000 | 0.000 |
0.000 0.000 | 0.000 |
0.000 0.000 | 0.000 |
0.035 0.000 | 0.114 |
0.611 0.518 | 0.661 |
0.209 0.138 | 0.271 |
0.145 0.093 | 0.185 |
|||
| Plot | Lyso | Other | |||||||||||
| Expt C |
5 peptides |
16 spectra |
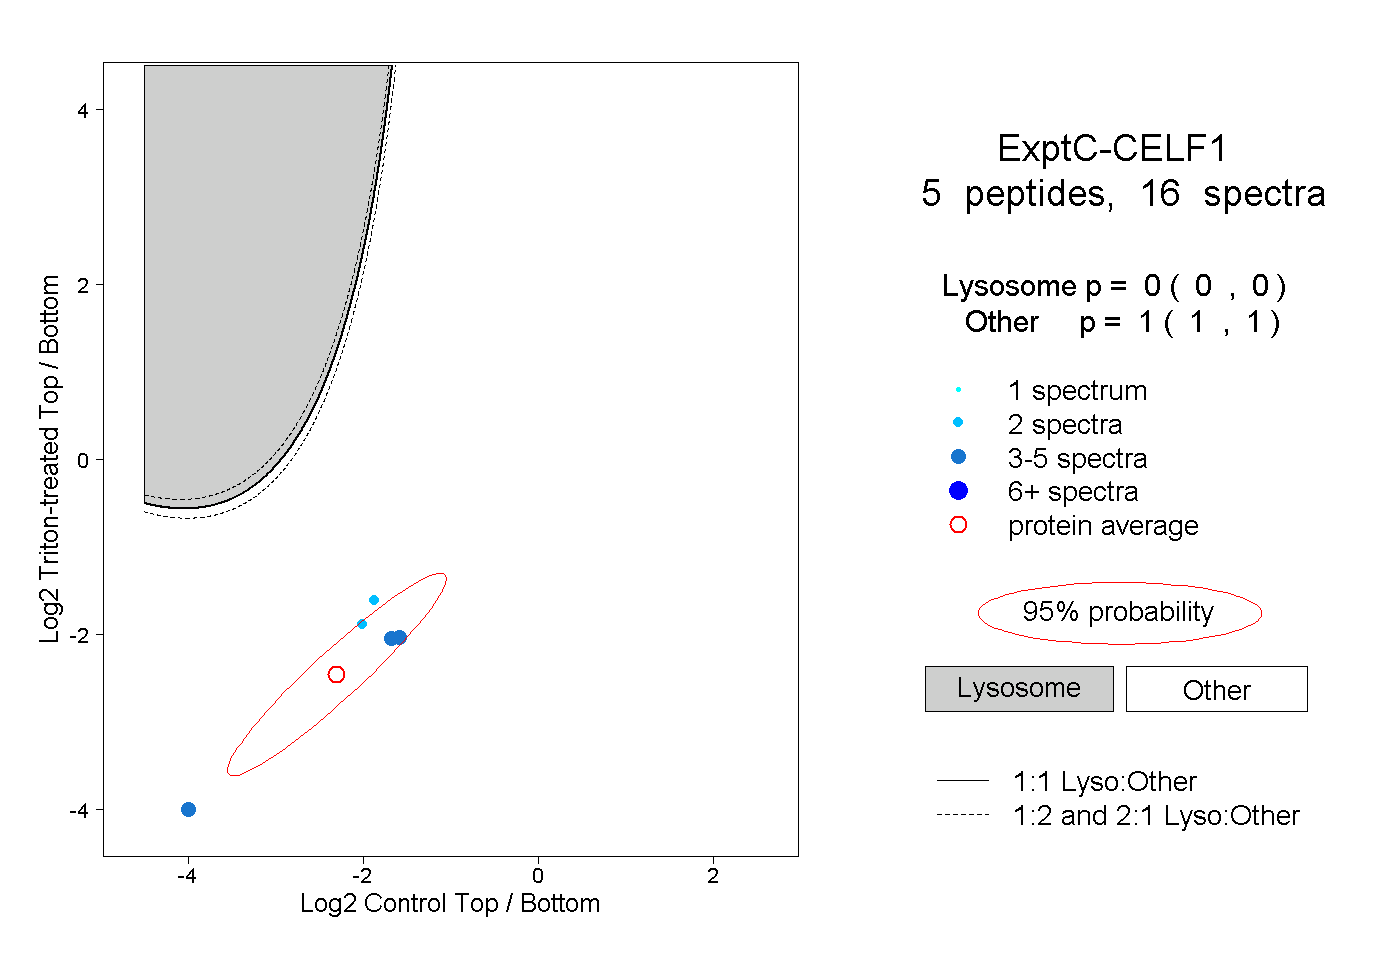 |
0.000 0.000 | 0.000 |
1.000 1.000 | 1.000 |
||||||||
| Plot | Lyso | Other | |||||||||||
| Expt D |
1 peptide |
3 spectra |
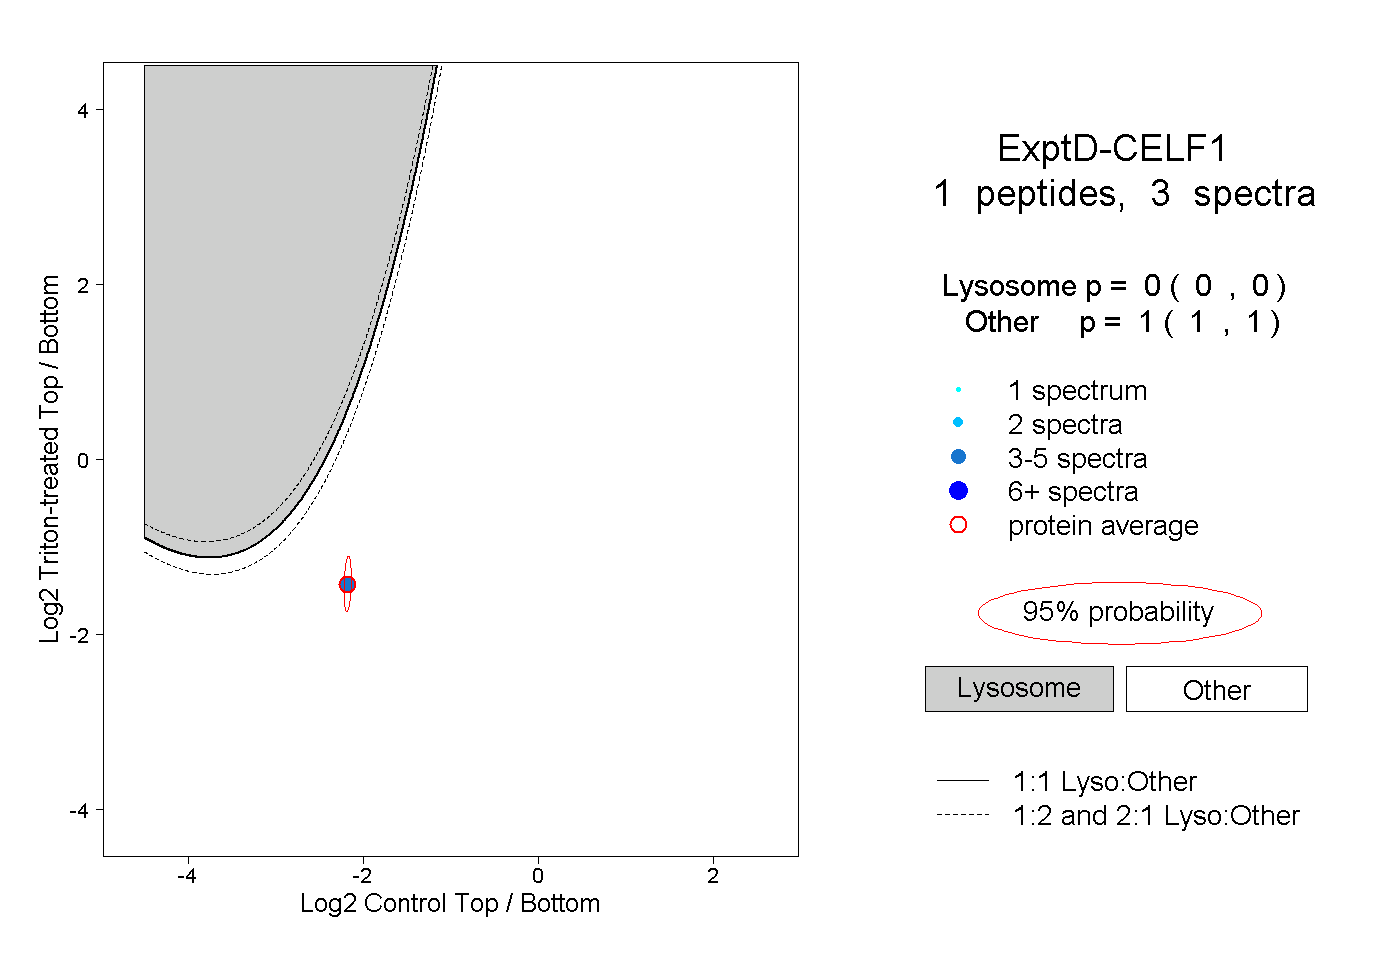 |
0.000 0.000 | 0.000 |
1.000 1.000 | 1.000 |