 12
12peptides
spectra
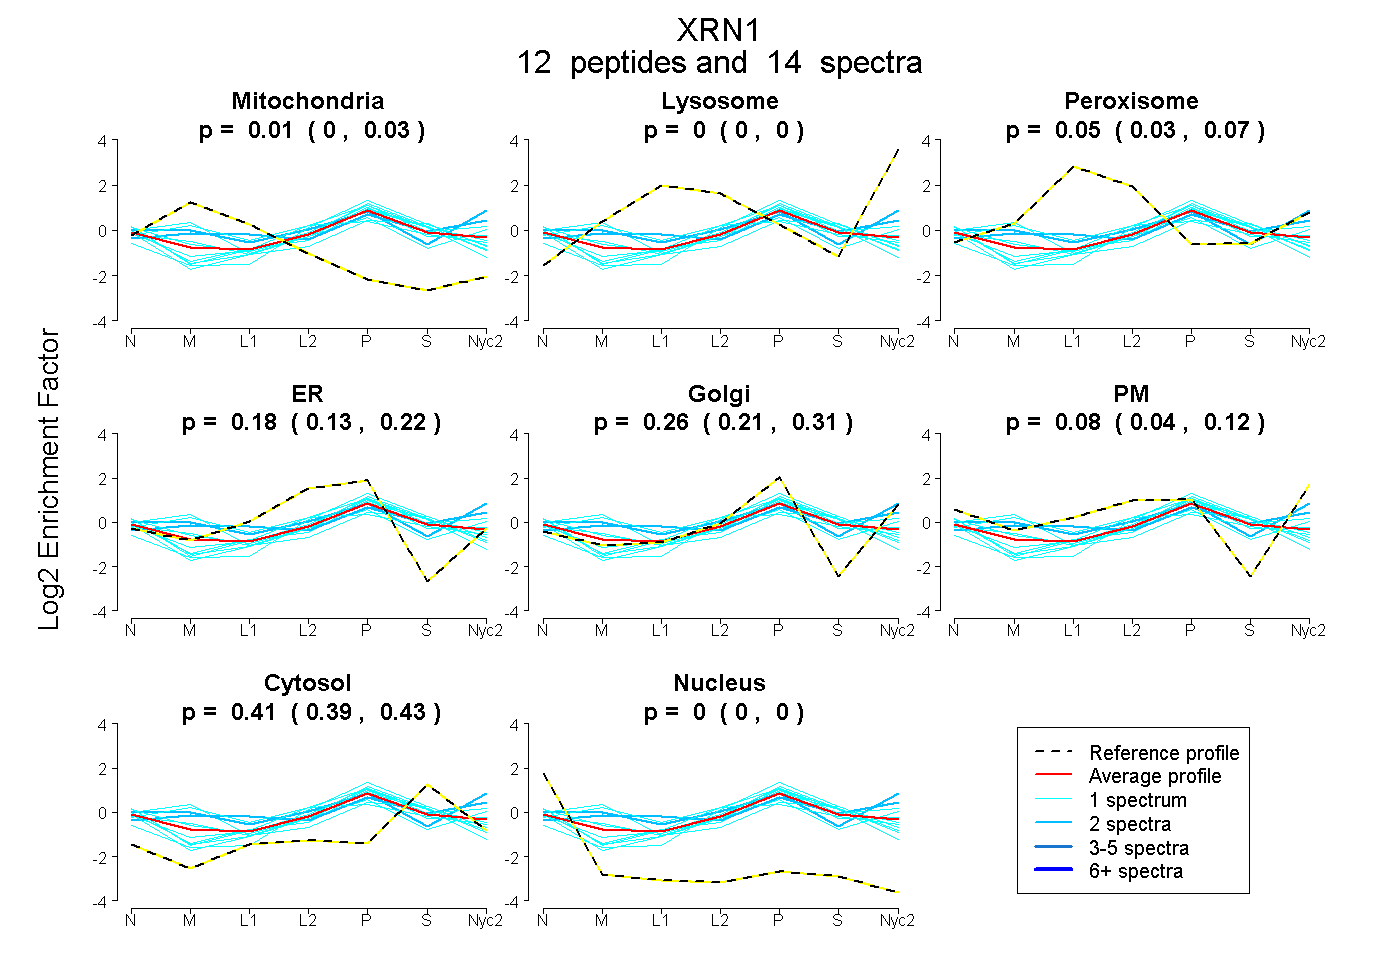
0.000 | 0.026
0.000 | 0.000
0.026 | 0.072
0.134 | 0.221
0.208 | 0.312
0.039 | 0.116
0.390 | 0.430
0.000 | 0.000
2peptides
spectra
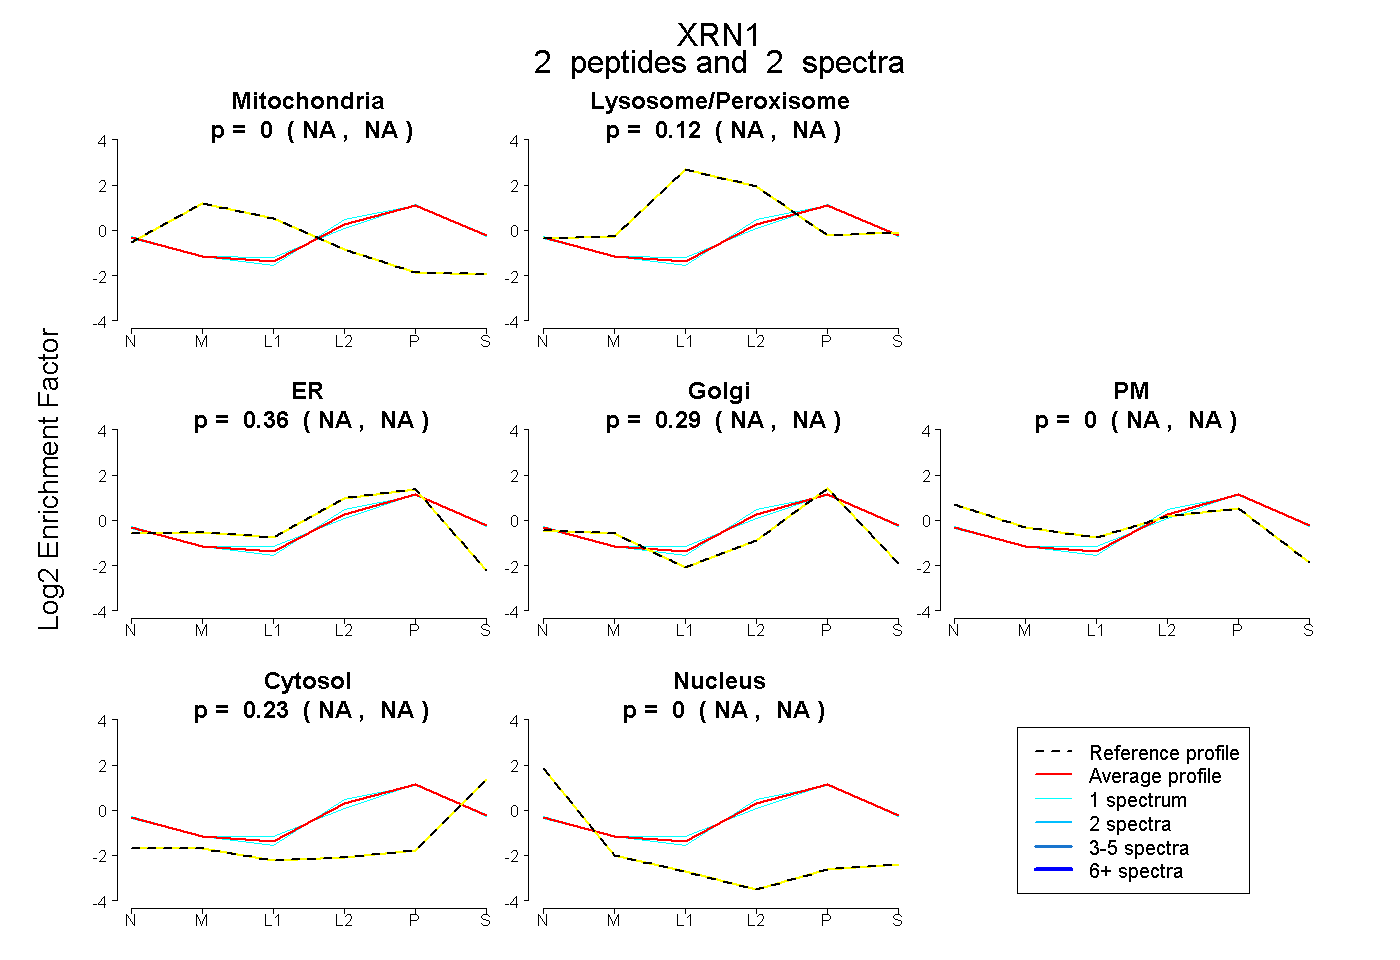
NA | NA
NA | NA
NA | NA
NA | NA
NA | NA
NA | NA
NA | NA
5peptides
spectra
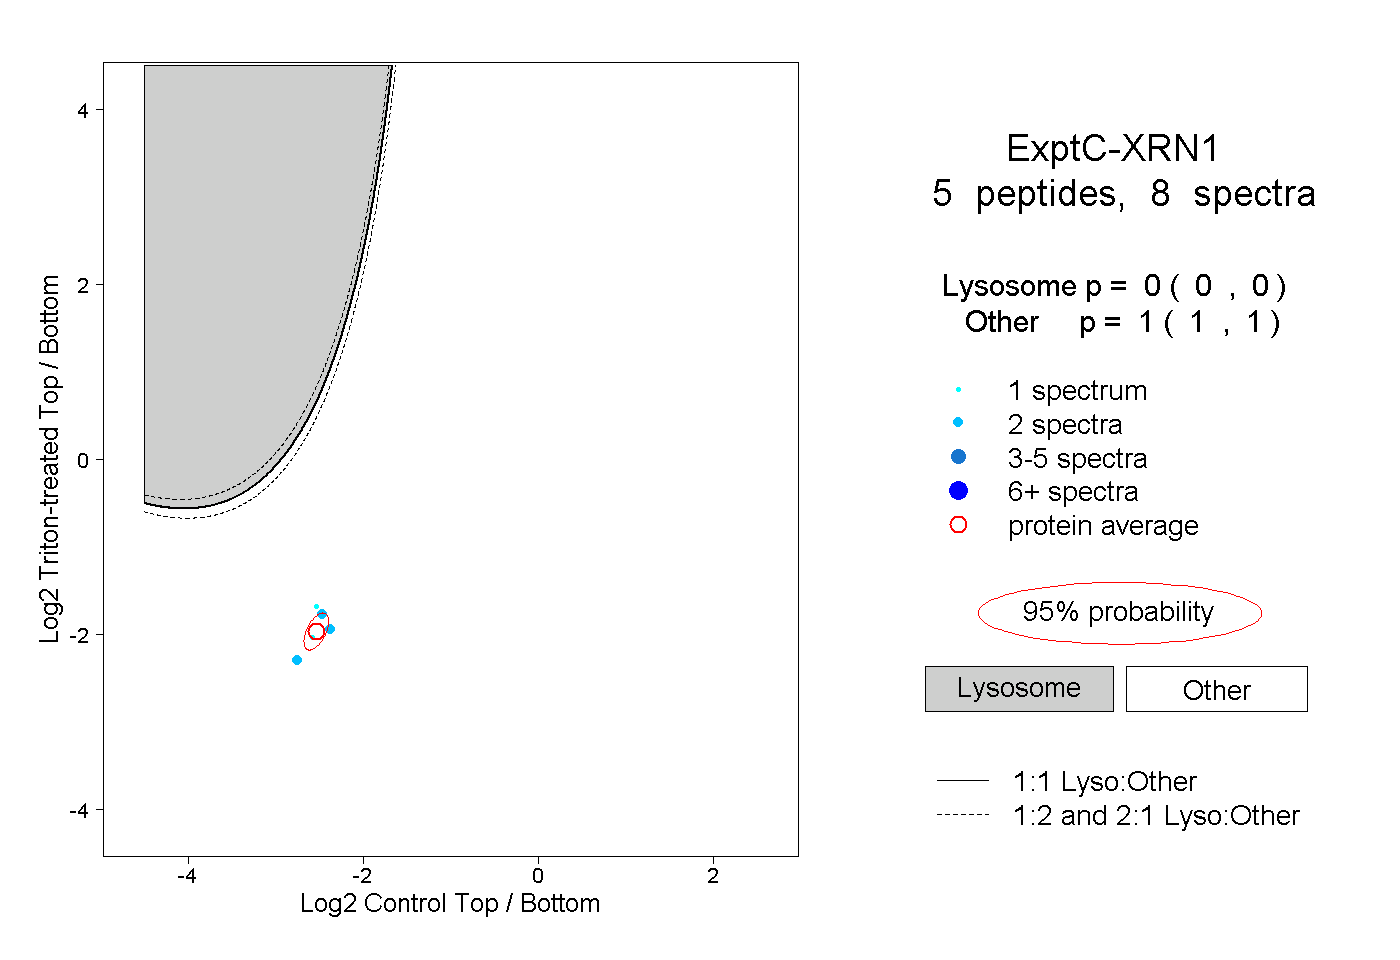
0.000 | 0.000
1.000 | 1.000