 12
12peptides
spectra
0.000 | 0.026
0.000 | 0.000
0.026 | 0.072
0.134 | 0.221
0.208 | 0.312
0.039 | 0.116
0.390 | 0.430
0.000 | 0.000
| Plot | Mito | Lyso | Perox | ER | Golgi | PM | Cytosol | Nucleus | |||||
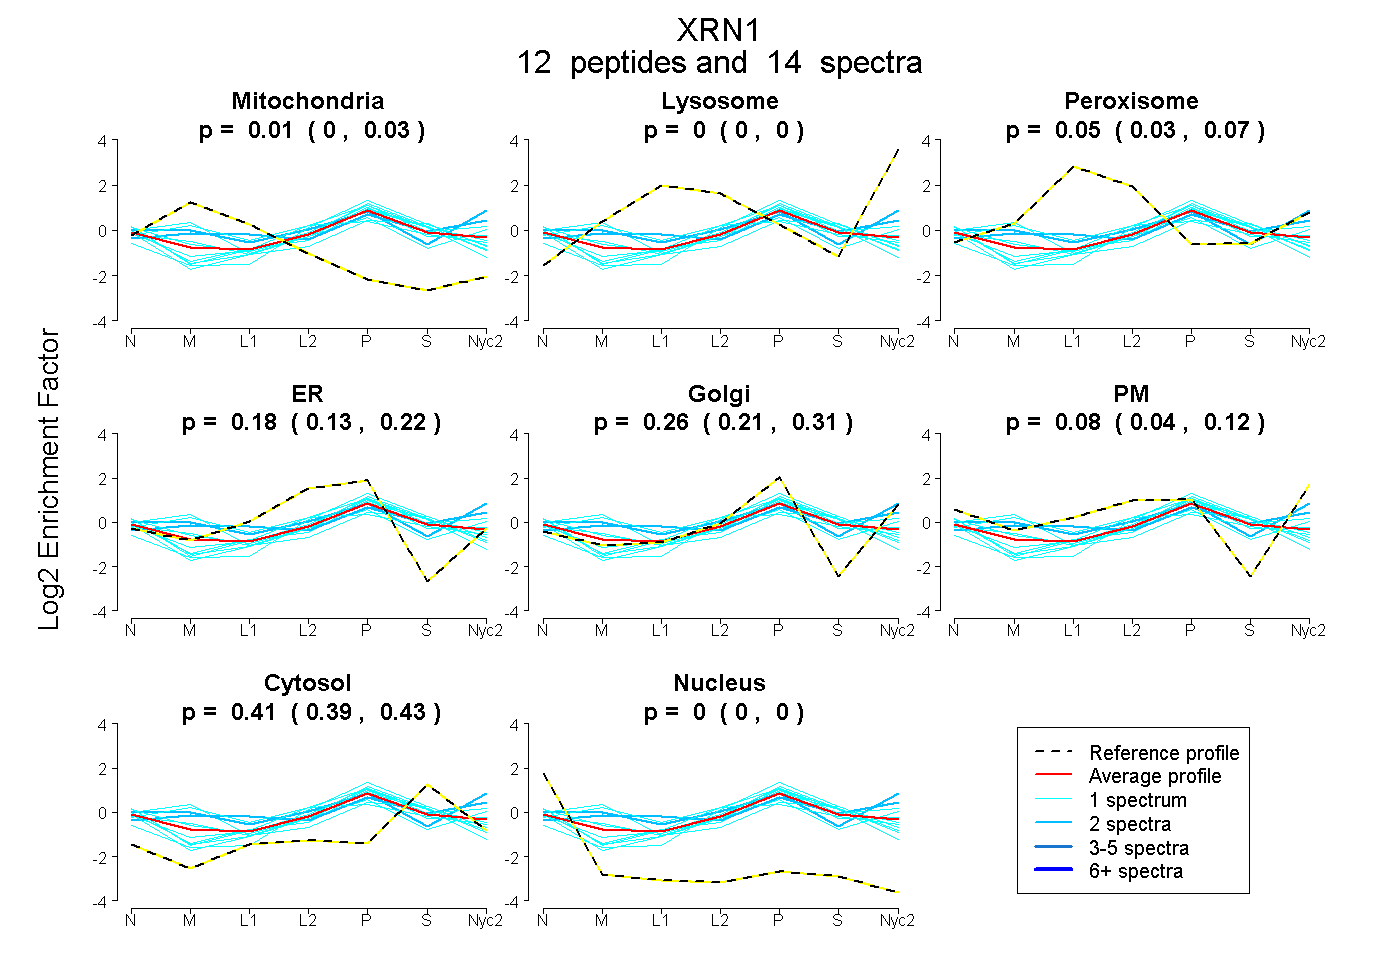
| Expt A |
12 peptides |
14 spectra |
|
0.011 0.000 | 0.026 |
0.000 0.000 | 0.000 |
0.050 0.026 | 0.072 |
0.181 0.134 | 0.221 |
0.265 0.208 | 0.312 |
0.081 0.039 | 0.116 |
0.413 0.390 | 0.430 |
0.000 0.000 | 0.000 |
| 1 spectrum, ENFSVPVGLR | 0.000 | 0.000 | 0.024 | 0.294 | 0.234 | 0.000 | 0.449 | 0.000 | ||
| 1 spectrum, EIQGISEQYLR | 0.000 | 0.000 | 0.000 | 0.318 | 0.167 | 0.000 | 0.511 | 0.004 | ||
| 1 spectrum, ALYFCGFPTLK | 0.204 | 0.000 | 0.000 | 0.000 | 0.313 | 0.256 | 0.227 | 0.000 | ||
| 1 spectrum, GHPVSTLSR | 0.159 | 0.000 | 0.192 | 0.178 | 0.182 | 0.000 | 0.289 | 0.000 | ||
| 2 spectra, EYIDYEFSALK | 0.040 | 0.072 | 0.197 | 0.000 | 0.389 | 0.000 | 0.301 | 0.000 | ||
| 1 spectrum, YNPGYVLAGR | 0.124 | 0.000 | 0.046 | 0.030 | 0.332 | 0.000 | 0.469 | 0.000 | ||
| 1 spectrum, IEEEVEK | 0.000 | 0.000 | 0.000 | 0.346 | 0.145 | 0.000 | 0.509 | 0.000 | ||
| 1 spectrum, IMEFIR | 0.000 | 0.000 | 0.000 | 0.293 | 0.213 | 0.000 | 0.494 | 0.000 | ||
| 1 spectrum, NPHGDHK | 0.000 | 0.000 | 0.000 | 0.169 | 0.166 | 0.252 | 0.414 | 0.000 | ||
| 1 spectrum, YQVNQNGEVR | 0.042 | 0.000 | 0.000 | 0.118 | 0.314 | 0.161 | 0.365 | 0.000 | ||
| 1 spectrum, AKPDHDPNTR | 0.000 | 0.000 | 0.000 | 0.429 | 0.028 | 0.000 | 0.485 | 0.058 | ||
| 2 spectra, FTGSIFIGR | 0.037 | 0.071 | 0.022 | 0.000 | 0.187 | 0.430 | 0.253 | 0.000 |
| Plot | Mito | Lyso or Perox | ER | Golgi | PM | Cytosol | Nucleus | ||||||
| Expt B |
2 peptides |
2 spectra |
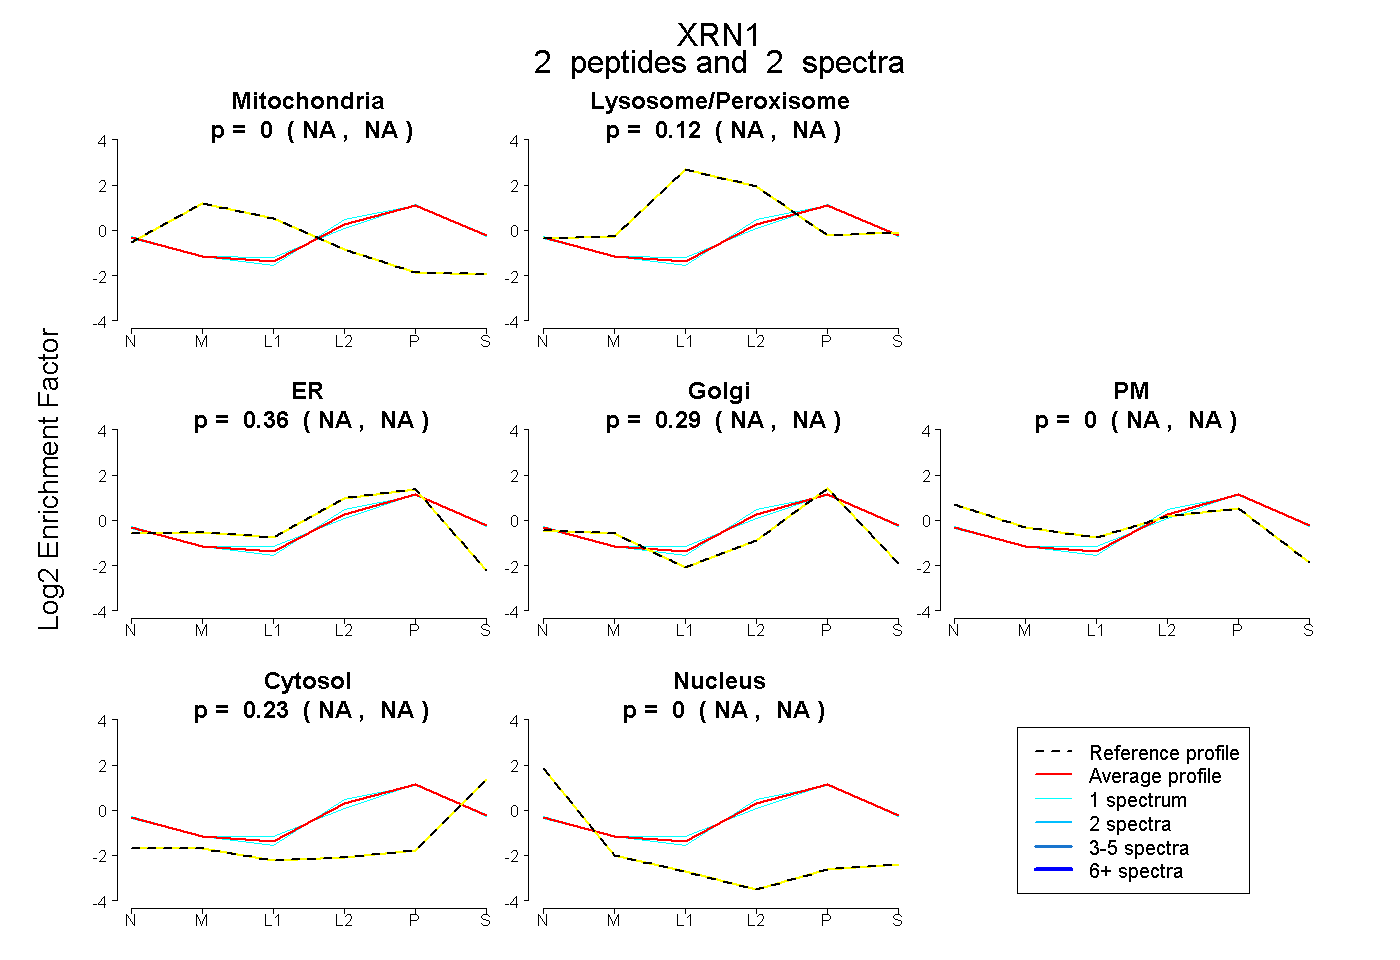 |
0.000 NA | NA |
0.125 NA | NA |
0.360 NA | NA |
0.288 NA | NA |
0.000 NA | NA |
0.227 NA | NA |
0.000 NA | NA |
|||
| Plot | Lyso | Other | |||||||||||
| Expt C |
5 peptides |
8 spectra |
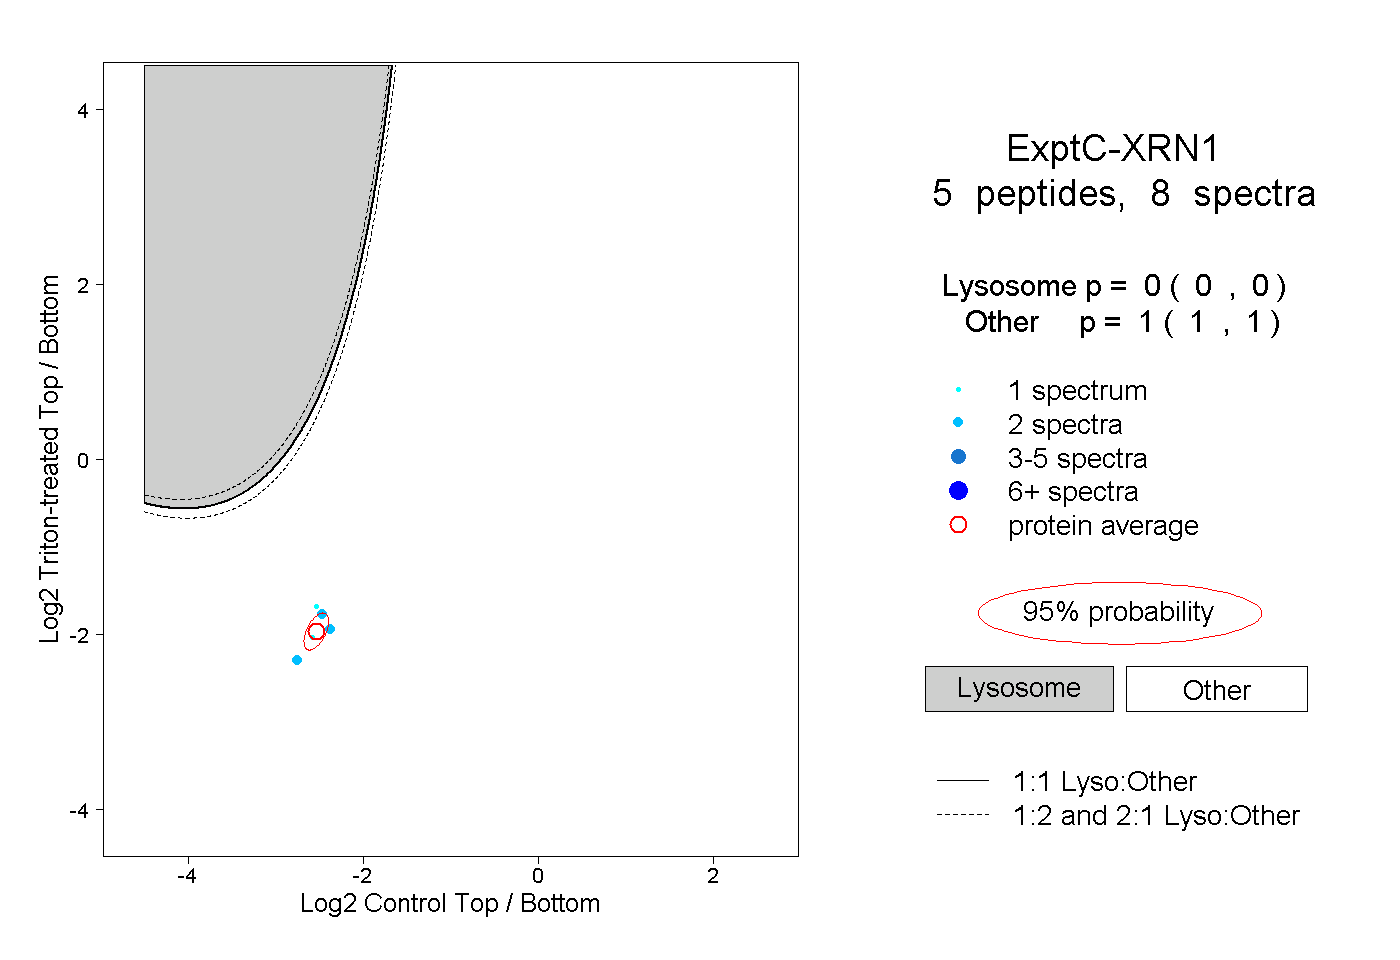 |
0.000 0.000 | 0.000 |
1.000 1.000 | 1.000 |