 3
3peptides
spectra
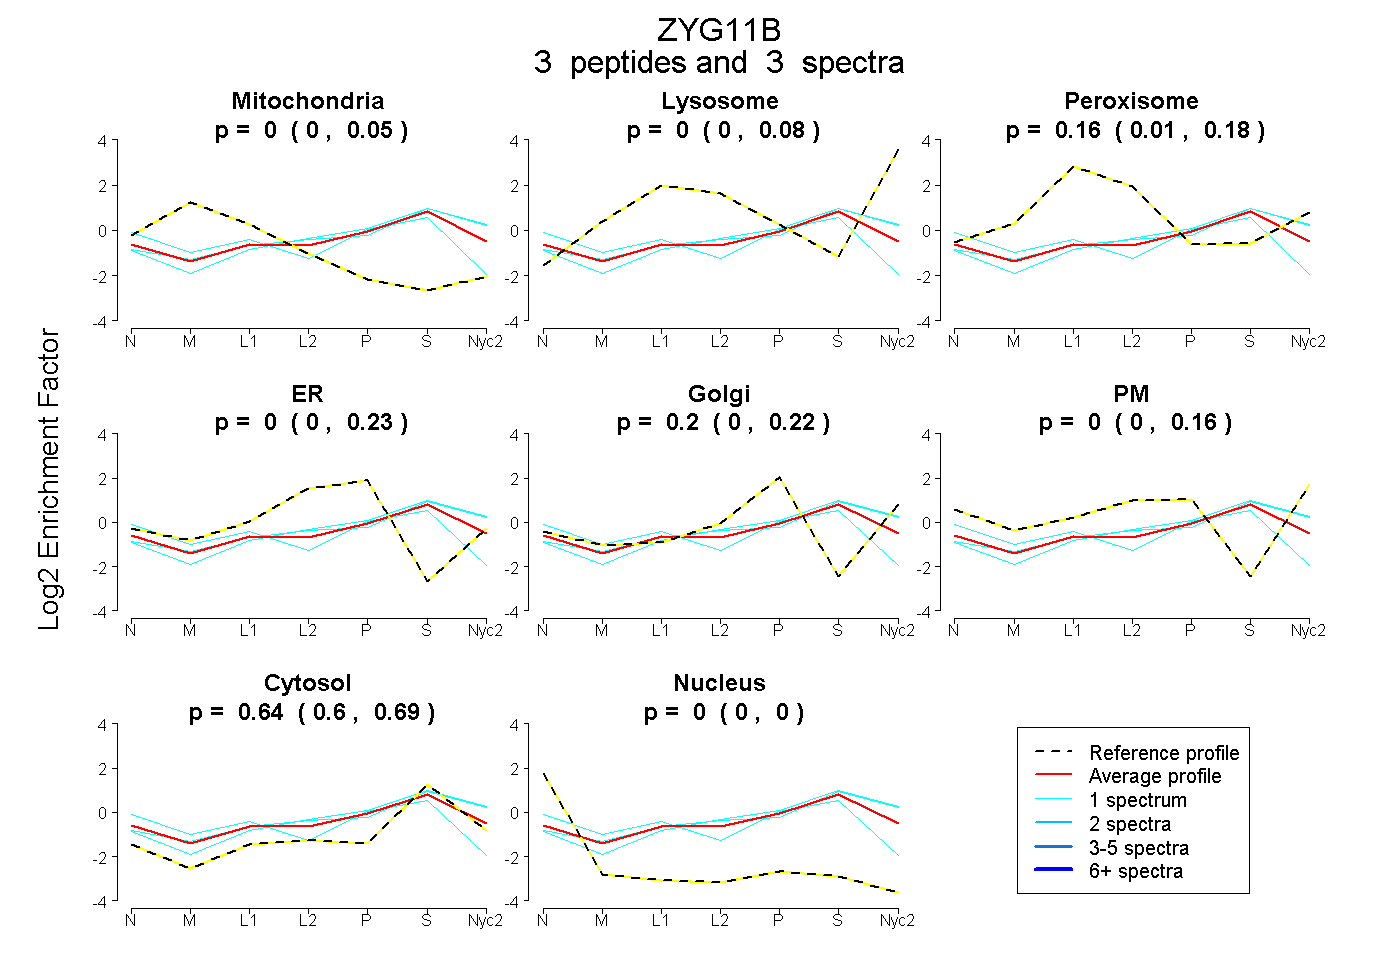
0.000 | 0.049
0.000 | 0.078
0.012 | 0.176
0.000 | 0.226
0.000 | 0.225
0.000 | 0.158
0.596 | 0.694
0.000 | 0.000
1peptide
spectrum
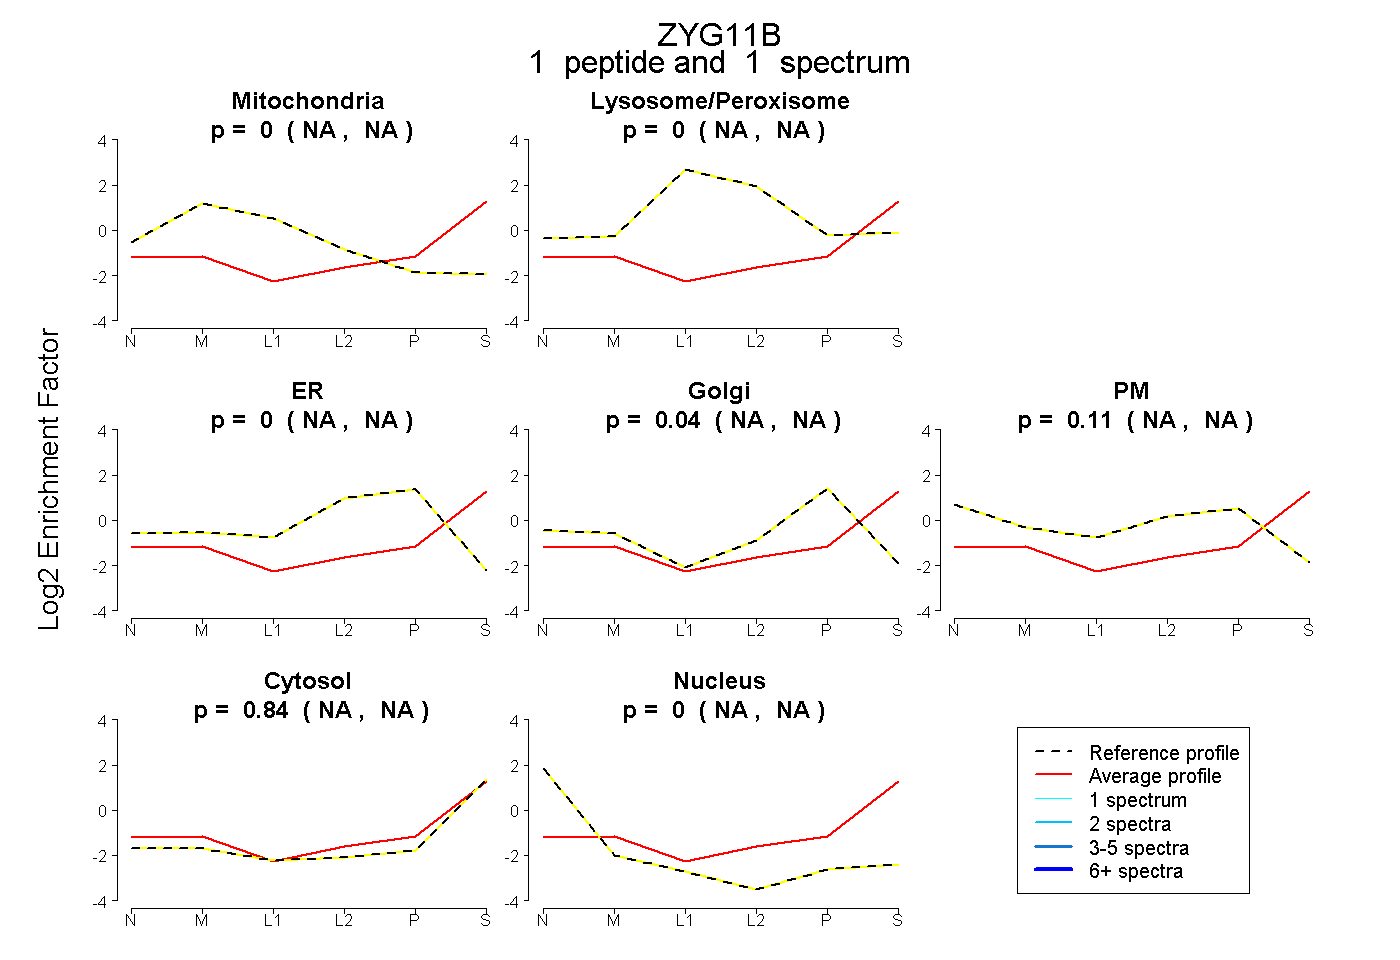
NA | NA
NA | NA
NA | NA
NA | NA
NA | NA
NA | NA
NA | NA
2peptides
spectra
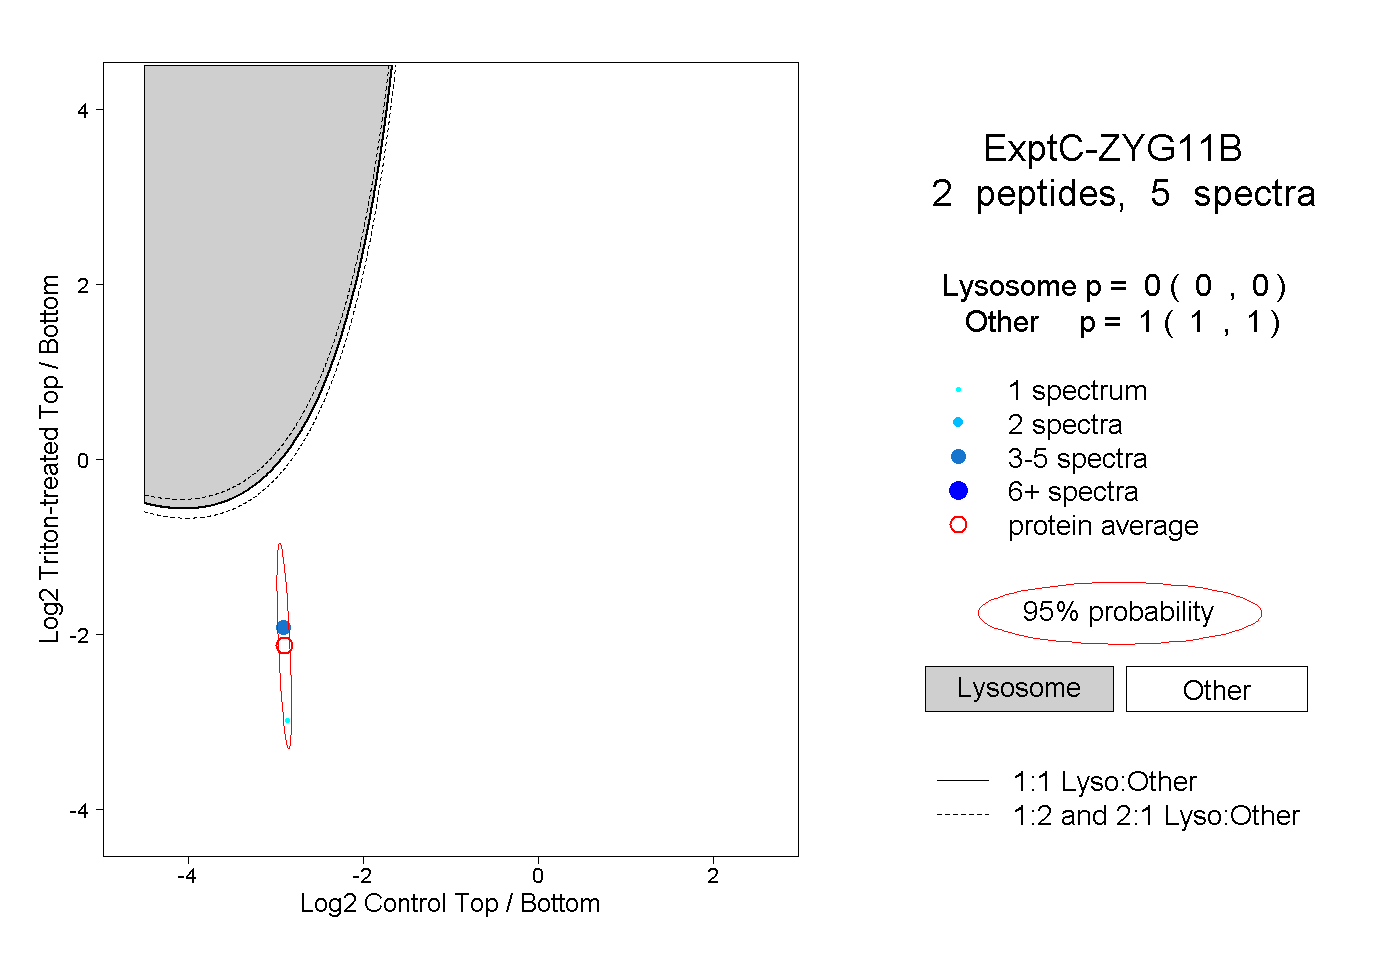
0.000 | 0.000
1.000 | 1.000