 3
3peptides
spectra
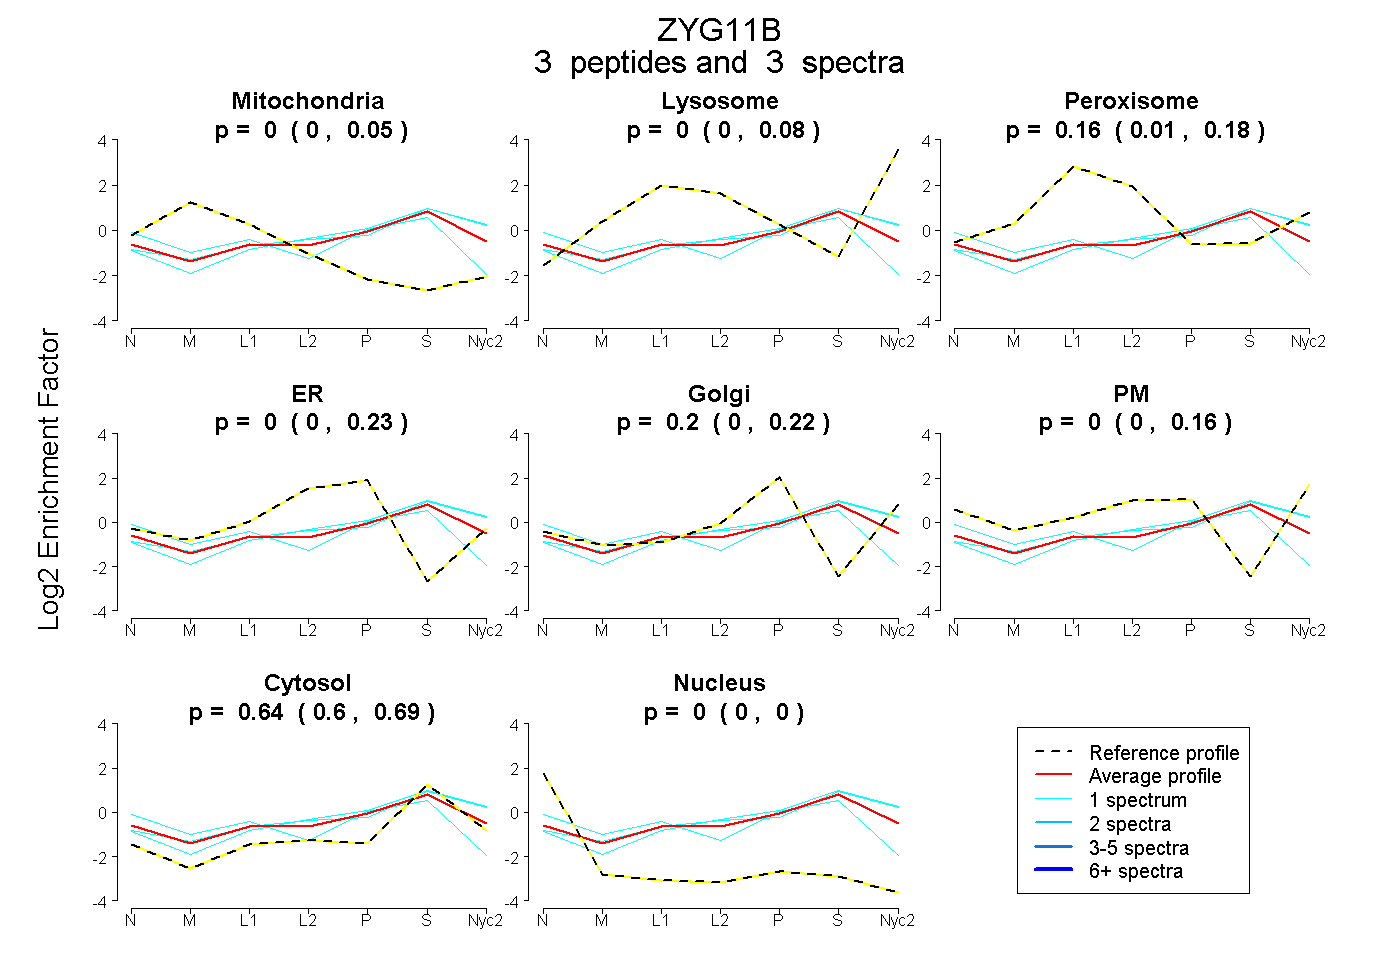
0.000 | 0.049
0.000 | 0.078
0.012 | 0.176
0.000 | 0.226
0.000 | 0.225
0.000 | 0.158
0.596 | 0.694
0.000 | 0.000
| Plot | Mito | Lyso | Perox | ER | Golgi | PM | Cytosol | Nucleus | |||||
| Expt A |
3 peptides |
3 spectra |
|
0.000 0.000 | 0.049 |
0.000 0.000 | 0.078 |
0.159 0.012 | 0.176 |
0.001 0.000 | 0.226 |
0.204 0.000 | 0.225 |
0.000 0.000 | 0.158 |
0.636 0.596 | 0.694 |
0.000 0.000 | 0.000 |
| 1 spectrum, LVVTGMR | 0.000 | 0.154 | 0.000 | 0.012 | 0.159 | 0.008 | 0.666 | 0.000 | ||
| 1 spectrum, NCLLSLCSDR | 0.198 | 0.000 | 0.000 | 0.193 | 0.000 | 0.000 | 0.580 | 0.030 | ||
| 1 spectrum, ILQDVPFNR | 0.000 | 0.134 | 0.071 | 0.000 | 0.065 | 0.078 | 0.652 | 0.000 |
| Plot | Mito | Lyso or Perox | ER | Golgi | PM | Cytosol | Nucleus | ||||||
| Expt B |
1 peptide |
1 spectrum |
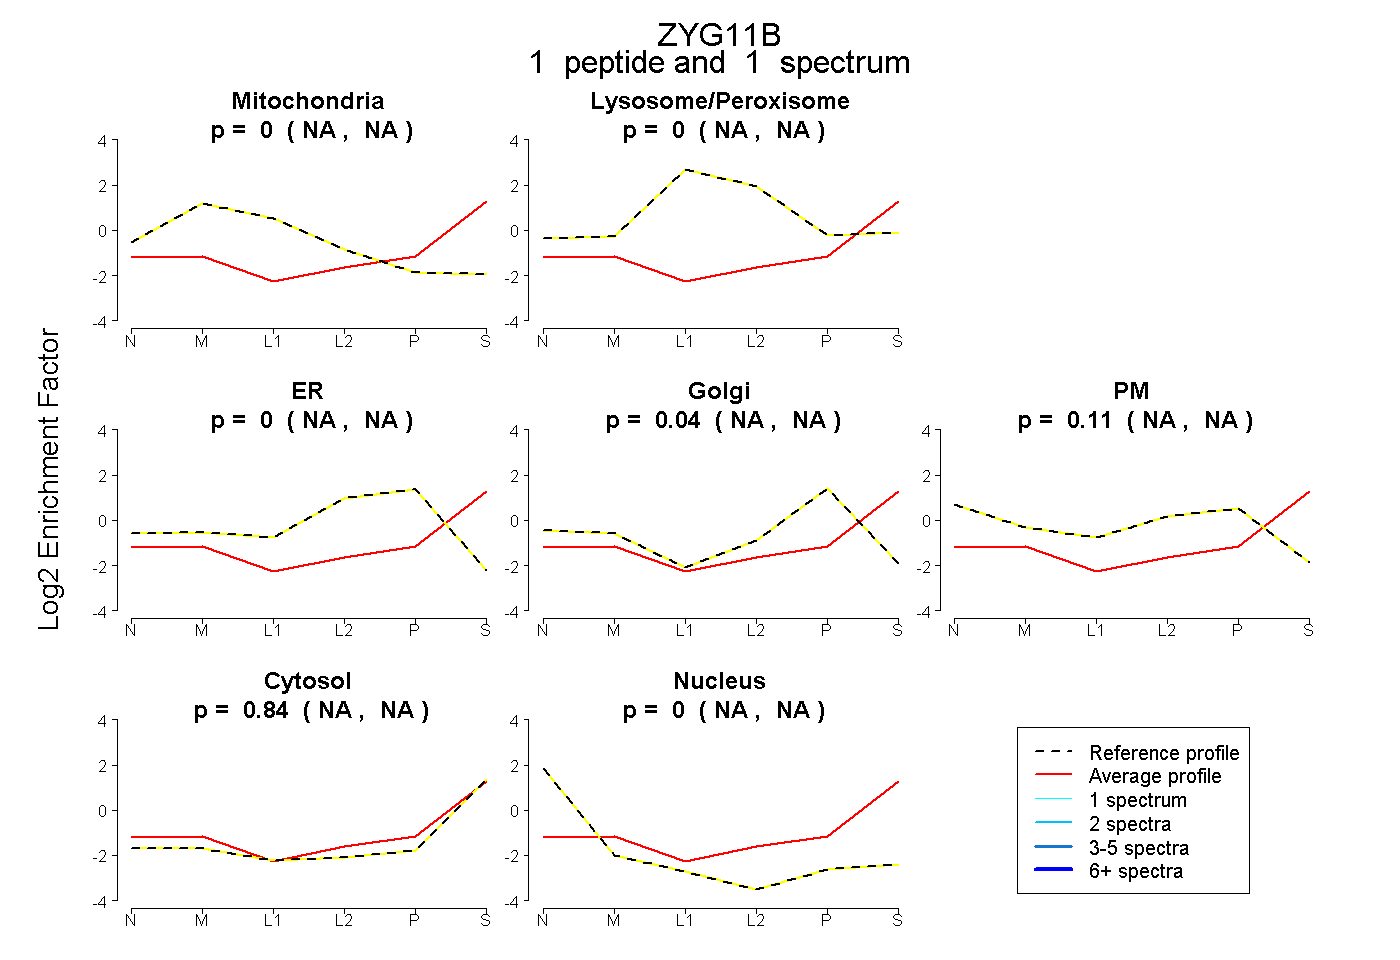 |
0.000 NA | NA |
0.000 NA | NA |
0.000 NA | NA |
0.043 NA | NA |
0.114 NA | NA |
0.843 NA | NA |
0.000 NA | NA |
|||
| Plot | Lyso | Other | |||||||||||
| Expt C |
2 peptides |
5 spectra |
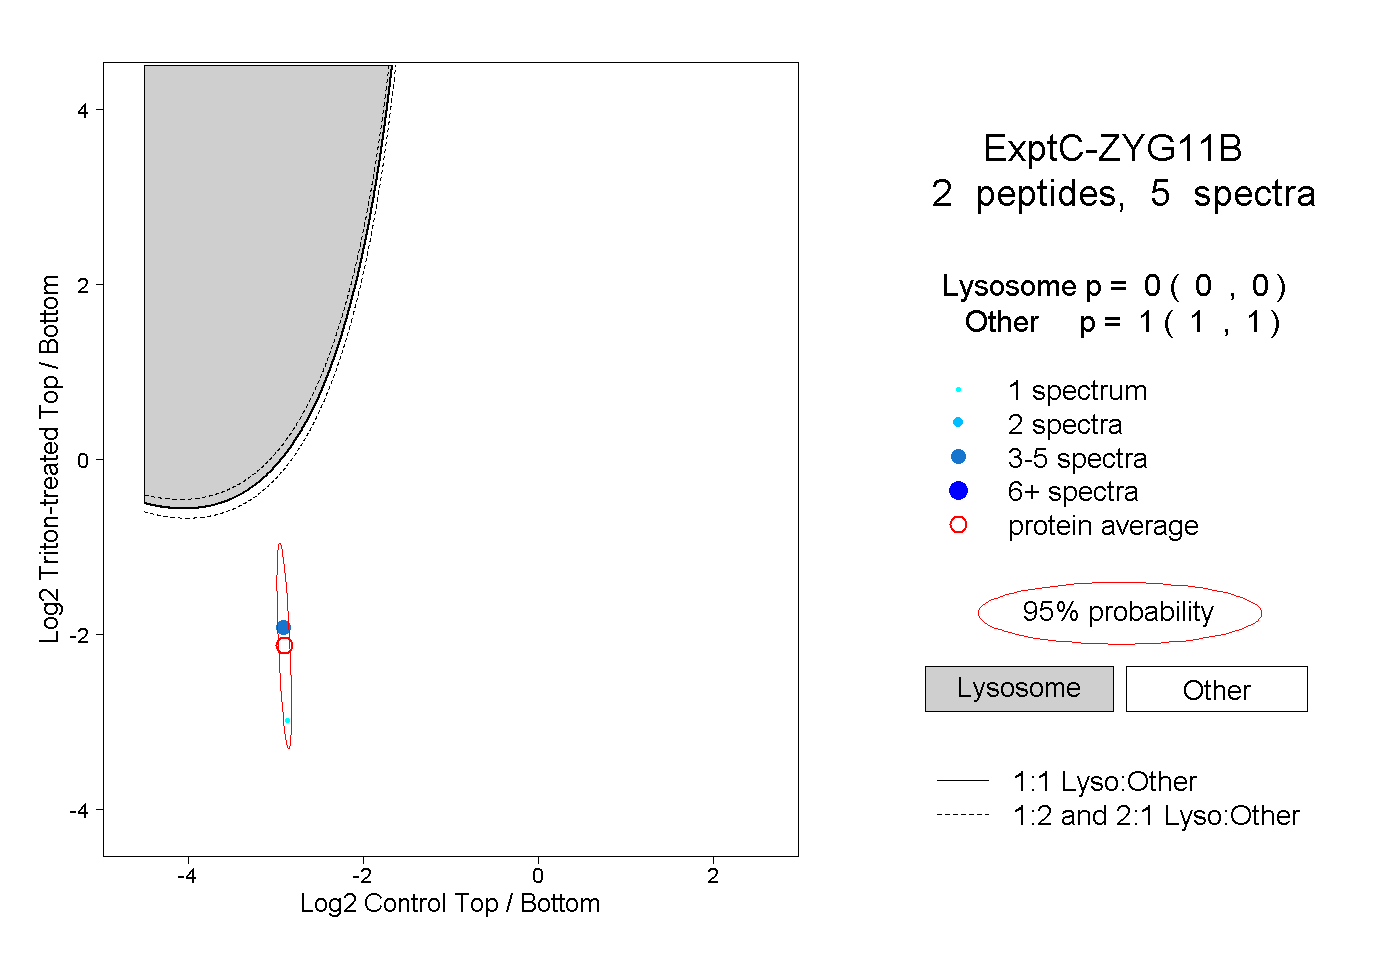 |
0.000 0.000 | 0.000 |
1.000 1.000 | 1.000 |