 7
7peptides
spectra
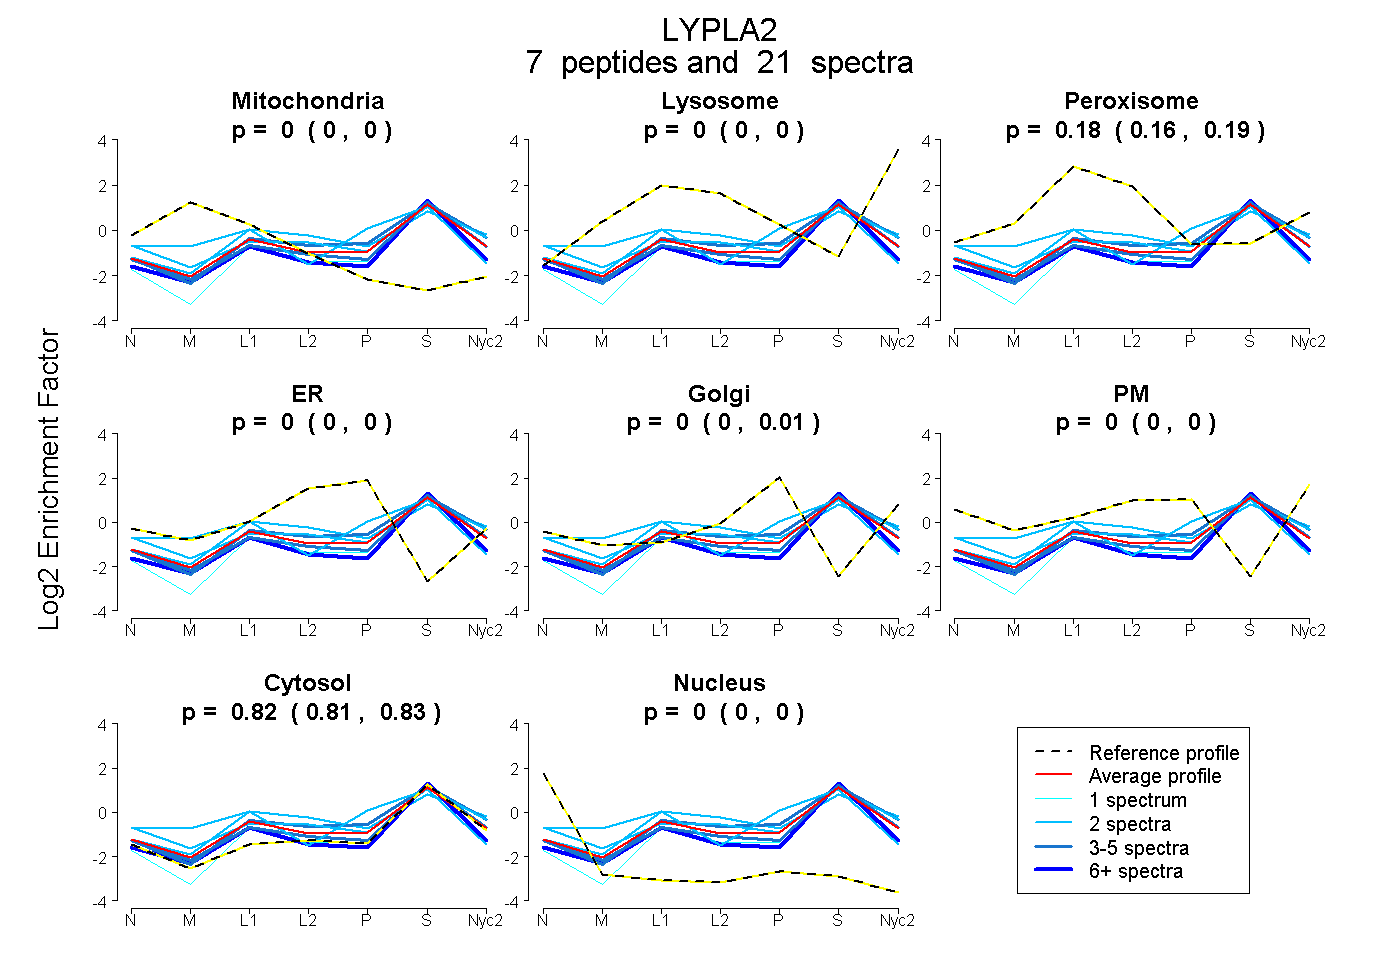
0.000 | 0.000
0.000 | 0.000
0.164 | 0.186
0.000 | 0.004
0.000 | 0.011
0.000 | 0.000
0.809 | 0.831
0.000 | 0.000
3peptides
spectra
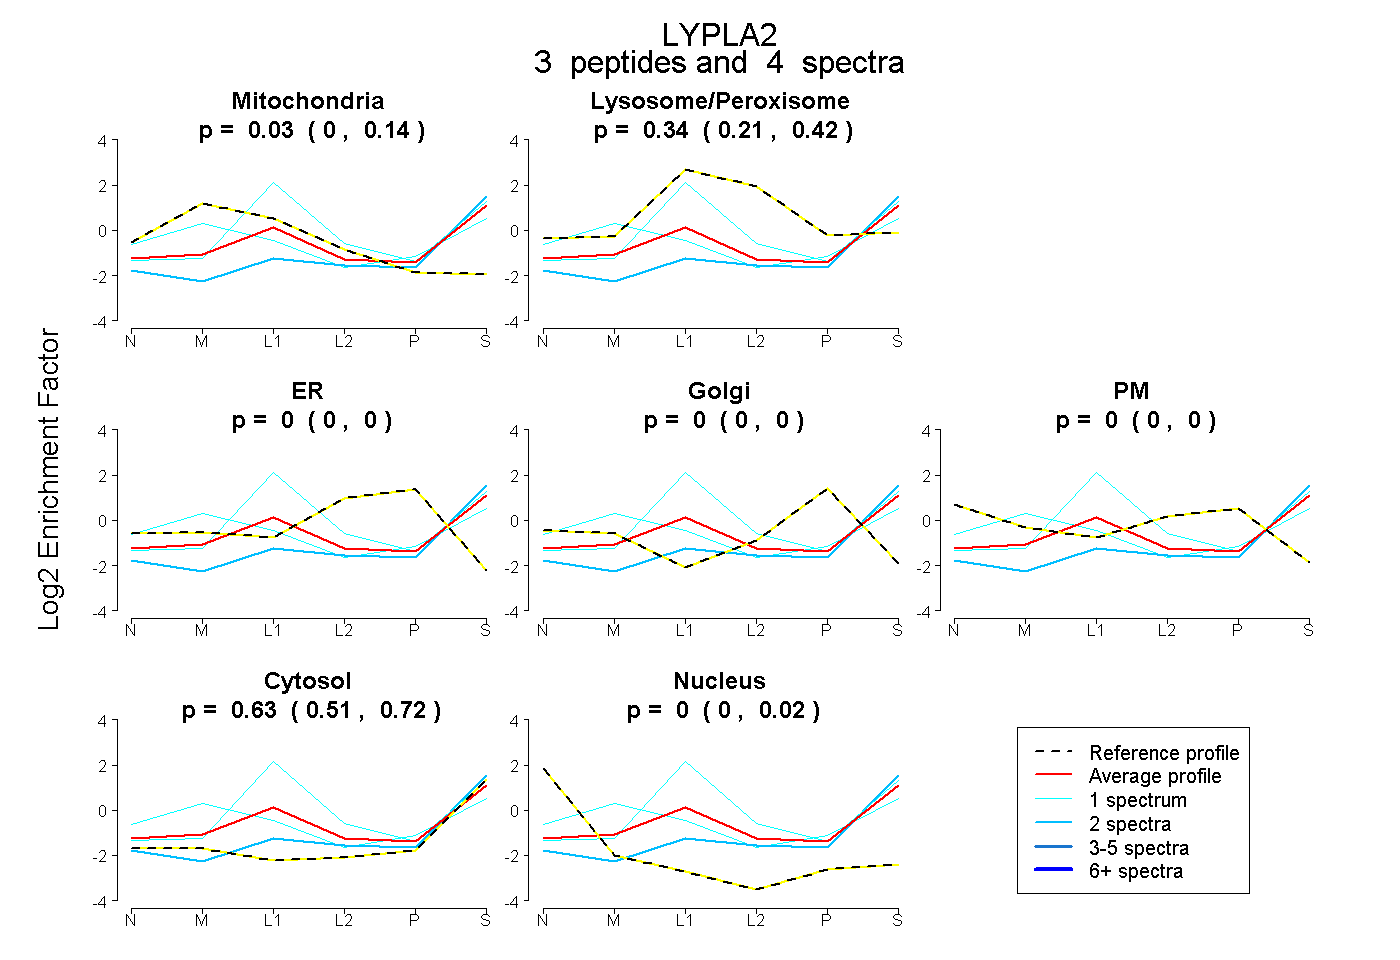
0.000 | 0.142
0.207 | 0.419
0.000 | 0.000
0.000 | 0.000
0.000 | 0.000
0.507 | 0.720
0.000 | 0.024
9peptides
spectra
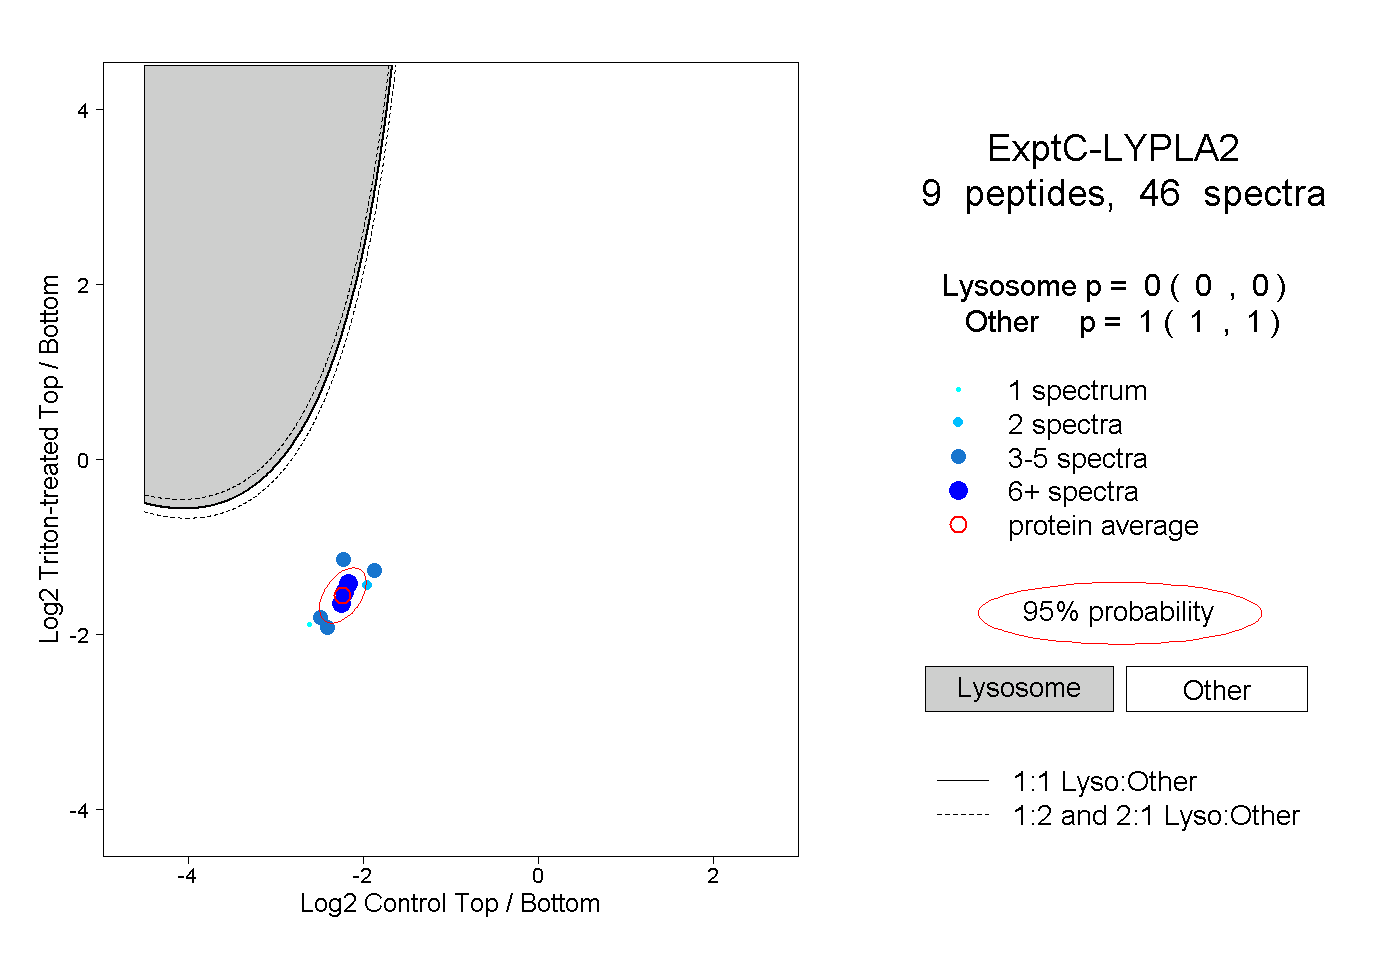
0.000 | 0.000
1.000 | 1.000
3peptides
spectra
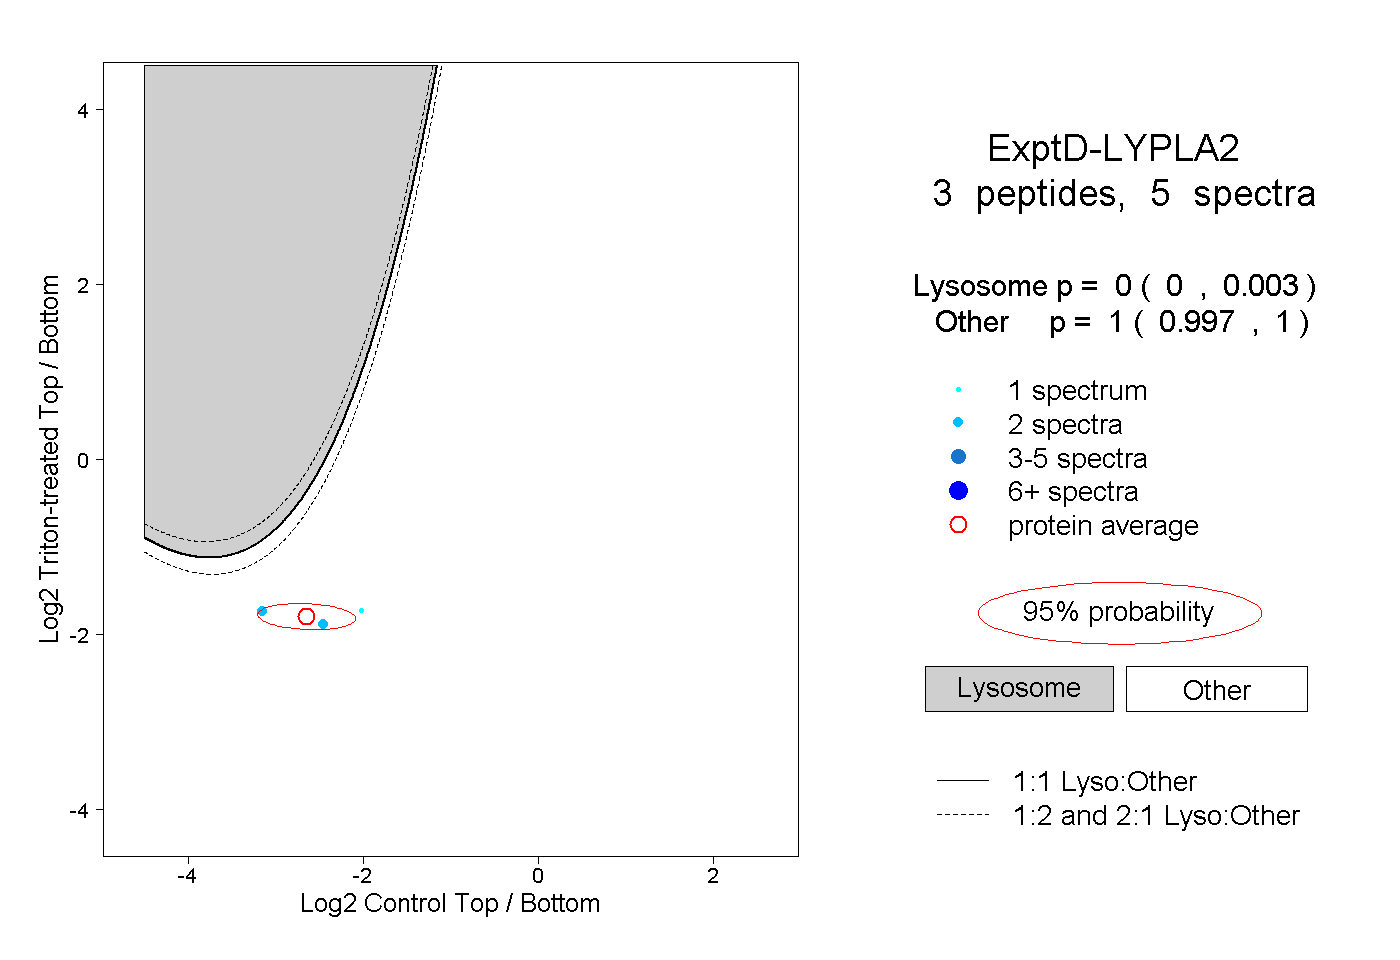
0.000 | 0.003
0.997 | 1.000