 7
7peptides
spectra
0.000 | 0.000
0.000 | 0.000
0.164 | 0.186
0.000 | 0.004
0.000 | 0.011
0.000 | 0.000
0.809 | 0.831
0.000 | 0.000
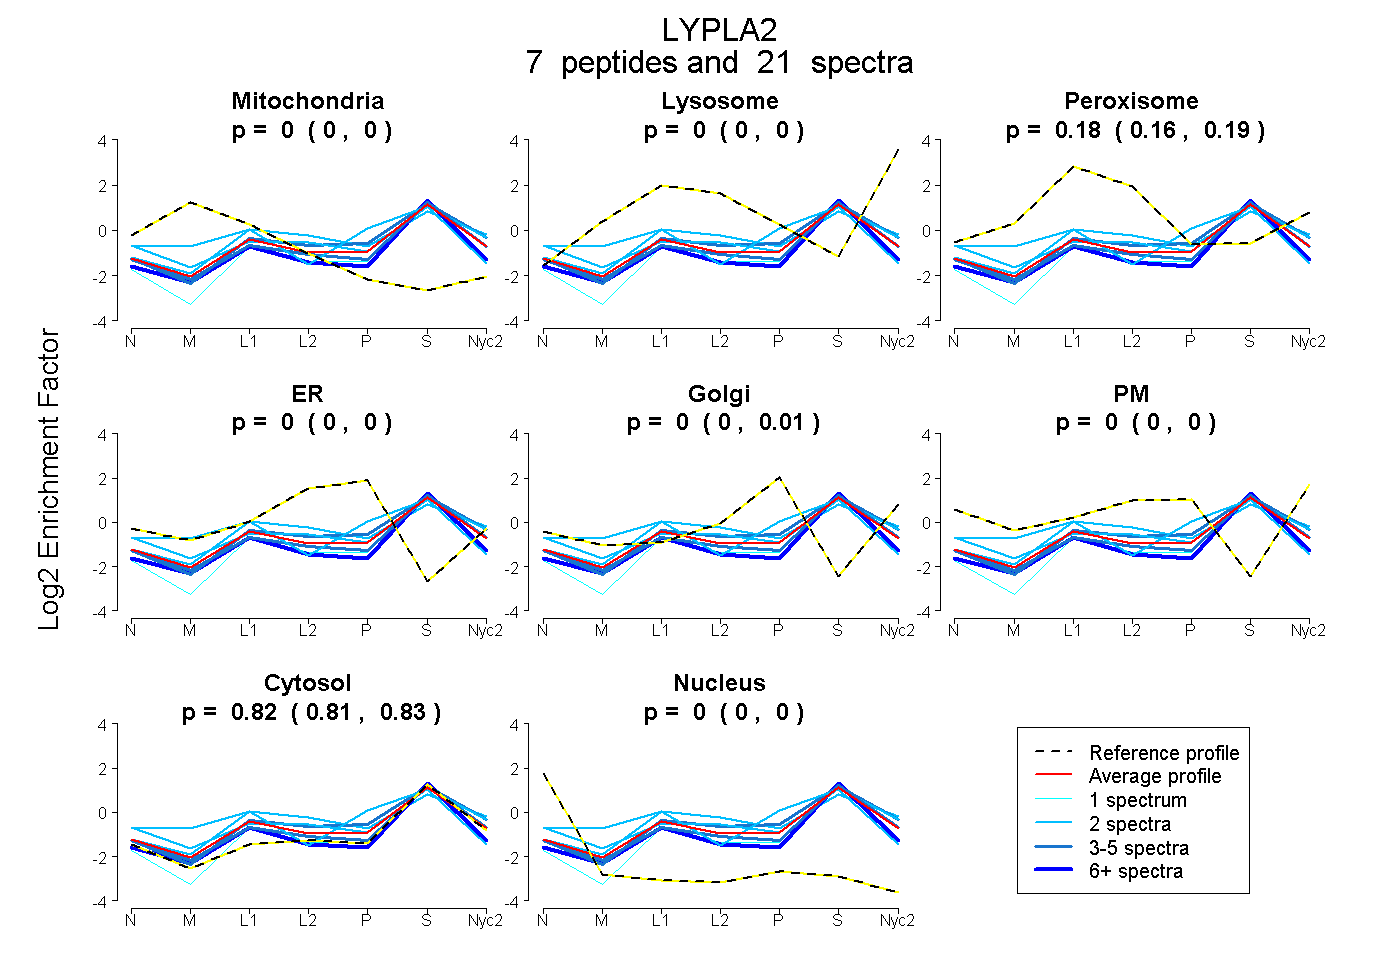
| Plot | Mito | Lyso | Perox | ER | Golgi | PM | Cytosol | Nucleus | |||||
| Expt A |
7 peptides |
21 spectra |
|
0.000 0.000 | 0.000 |
0.000 0.000 | 0.000 |
0.178 0.164 | 0.186 |
0.000 0.000 | 0.004 |
0.000 0.000 | 0.011 |
0.000 0.000 | 0.000 |
0.822 0.809 | 0.831 |
0.000 0.000 | 0.000 |
| 7 spectra, DLAILQCHGELDPMVPVR | 0.056 | 0.000 | 0.020 | 0.000 | 0.000 | 0.000 | 0.924 | 0.000 | ||
| 2 spectra, NGIPANR | 0.000 | 0.000 | 0.206 | 0.000 | 0.000 | 0.062 | 0.732 | 0.000 | ||
| 2 spectra, AAENIK | 0.032 | 0.000 | 0.352 | 0.000 | 0.000 | 0.049 | 0.566 | 0.000 | ||
| 4 spectra, IPVTLNMK | 0.000 | 0.055 | 0.126 | 0.019 | 0.014 | 0.000 | 0.786 | 0.000 | ||
| 1 spectrum, ALIEHEMK | 0.000 | 0.000 | 0.015 | 0.000 | 0.000 | 0.000 | 0.985 | 0.000 | ||
| 2 spectra, YICPHAPR | 0.016 | 0.000 | 0.088 | 0.123 | 0.000 | 0.000 | 0.773 | 0.000 | ||
| 3 spectra, TVVTPAR | 0.000 | 0.000 | 0.124 | 0.000 | 0.000 | 0.000 | 0.876 | 0.000 |
| Plot | Mito | Lyso or Perox | ER | Golgi | PM | Cytosol | Nucleus | ||||||
| Expt B |
3 peptides |
4 spectra |
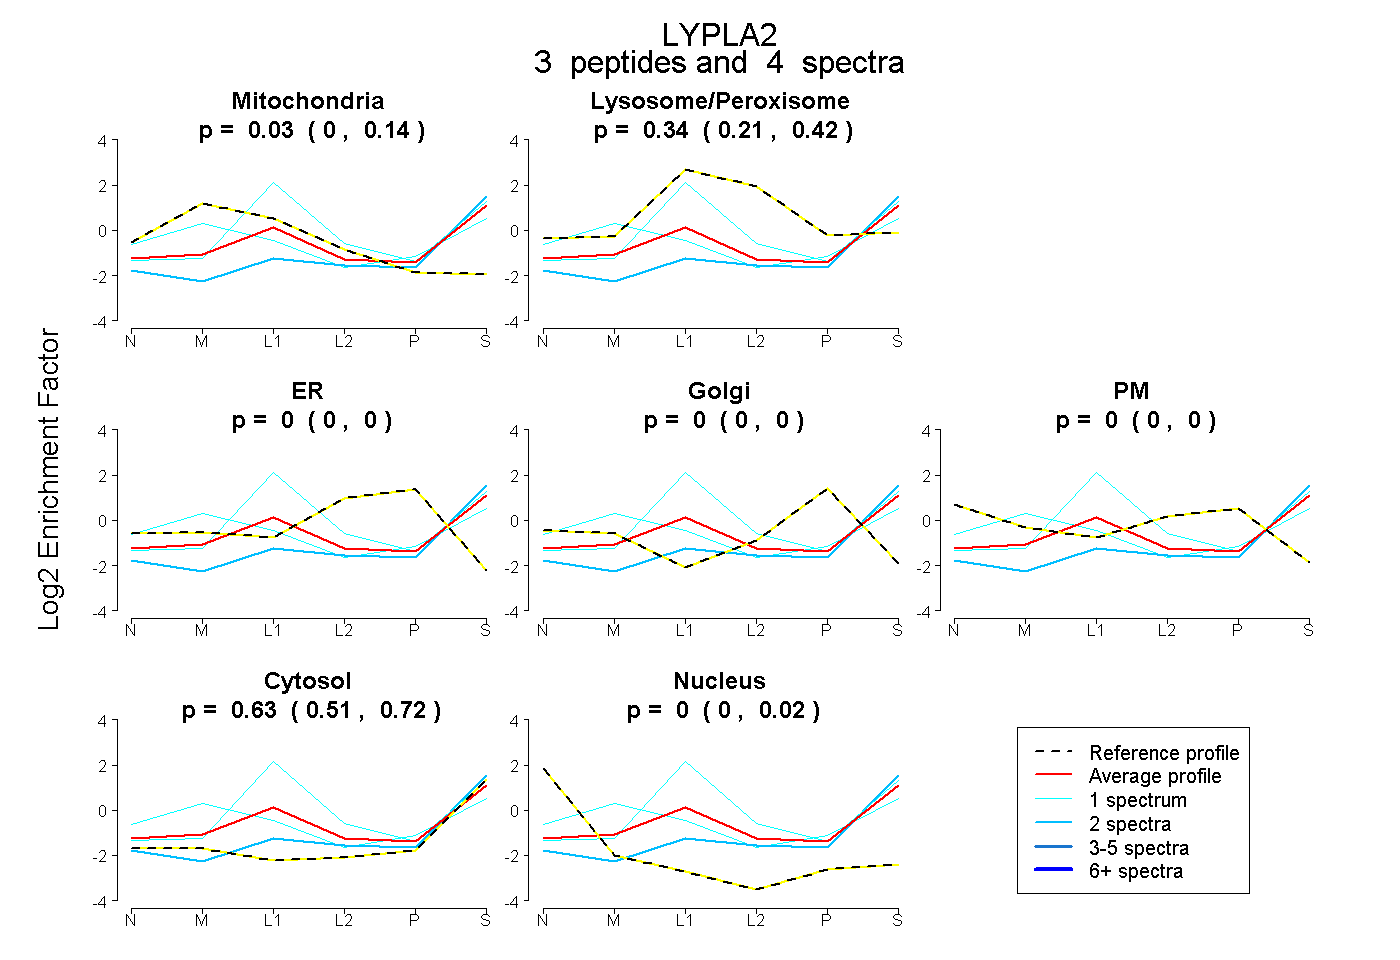 |
0.033 0.000 | 0.142 |
0.336 0.207 | 0.419 |
0.000 0.000 | 0.000 |
0.000 0.000 | 0.000 |
0.000 0.000 | 0.000 |
0.631 0.507 | 0.720 |
0.000 0.000 | 0.024 |
|||
| Plot | Lyso | Other | |||||||||||
| Expt C |
9 peptides |
46 spectra |
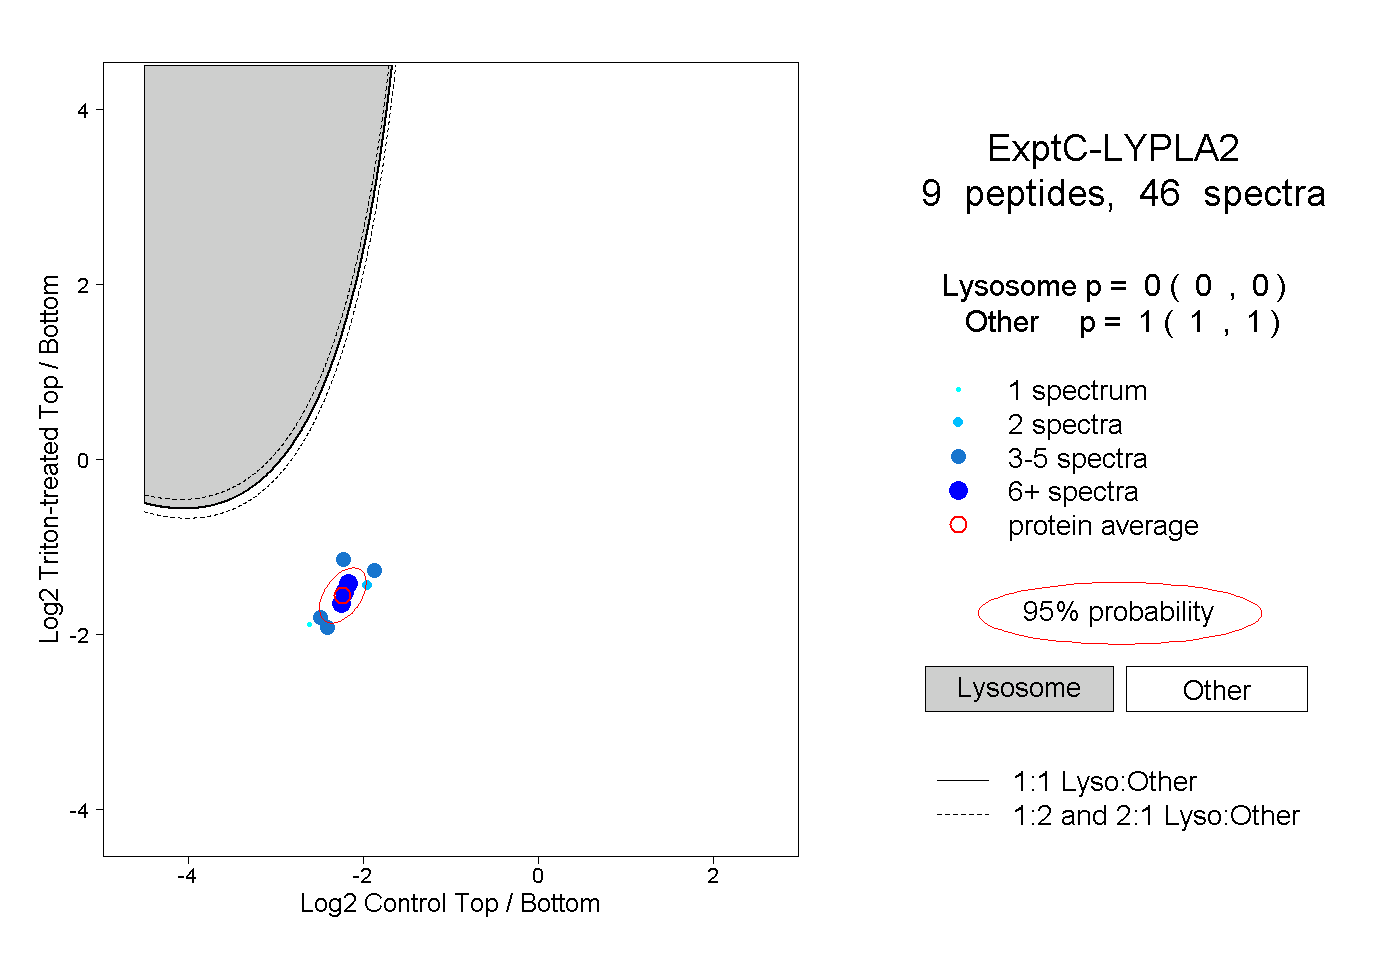 |
0.000 0.000 | 0.000 |
1.000 1.000 | 1.000 |
||||||||
| Plot | Lyso | Other | |||||||||||
| Expt D |
3 peptides |
5 spectra |
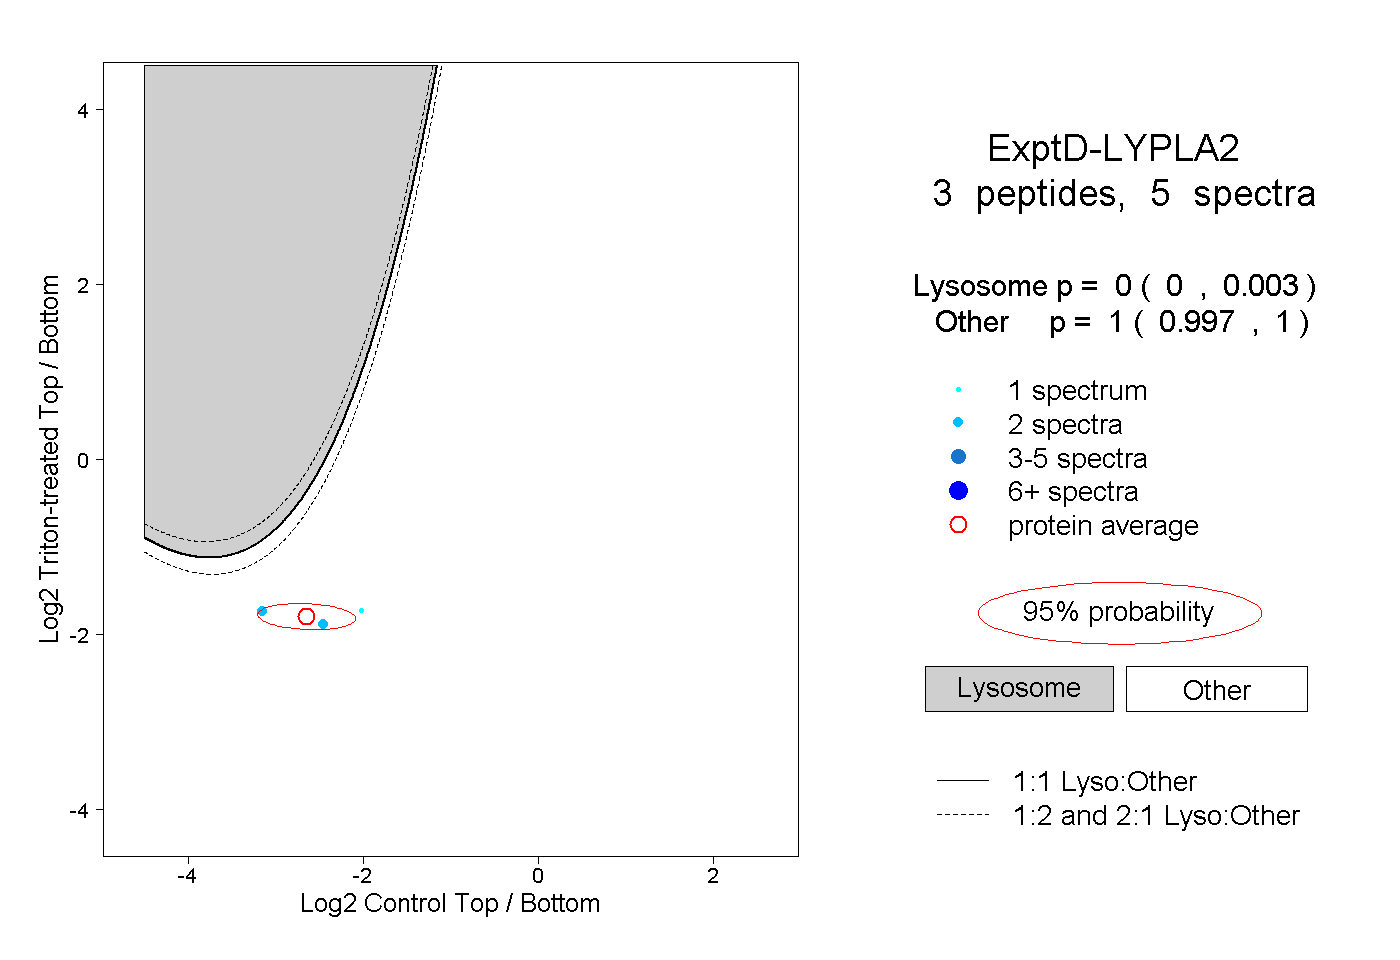 |
0.000 0.000 | 0.003 |
1.000 0.997 | 1.000 |