 3
3peptides
spectra
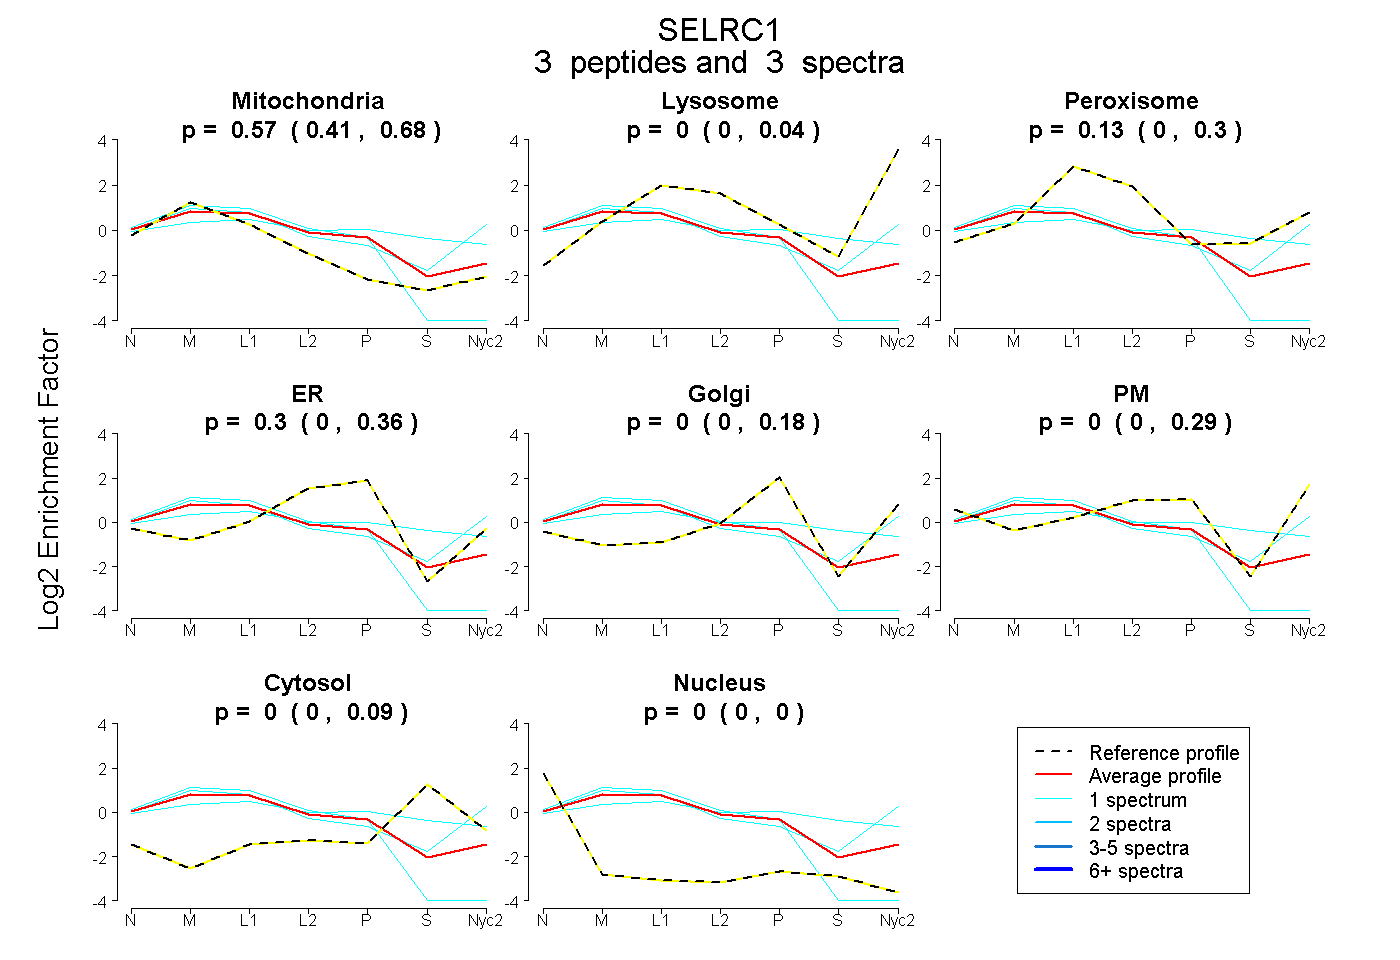
0.406 | 0.681
0.000 | 0.042
0.000 | 0.298
0.000 | 0.358
0.000 | 0.175
0.000 | 0.286
0.000 | 0.092
0.000 | 0.000
1peptide
spectrum
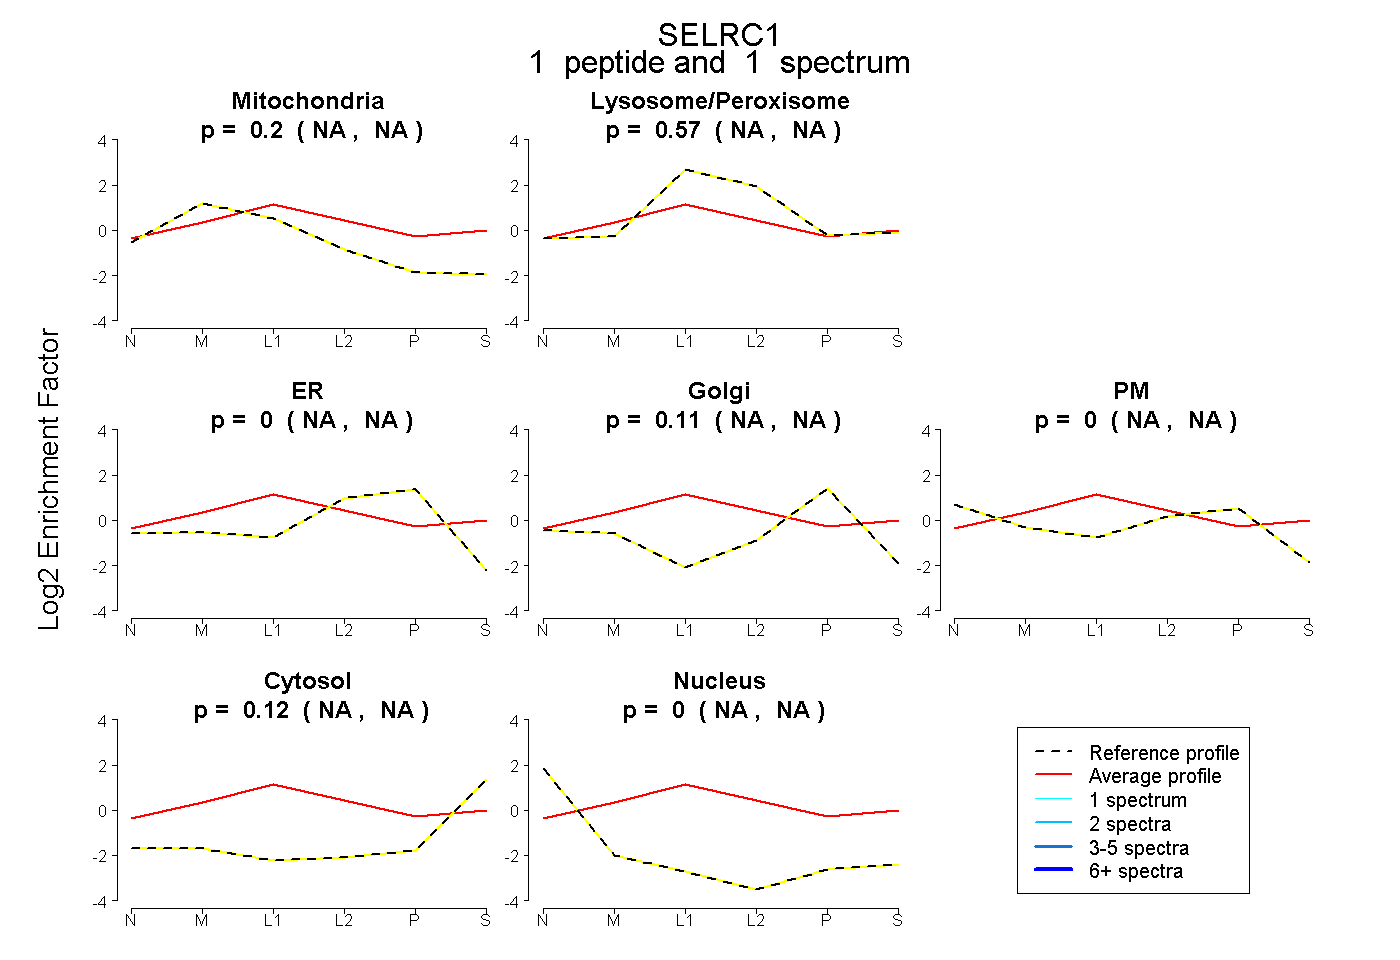
NA | NA
NA | NA
NA | NA
NA | NA
NA | NA
NA | NA
NA | NA
7peptides
spectra
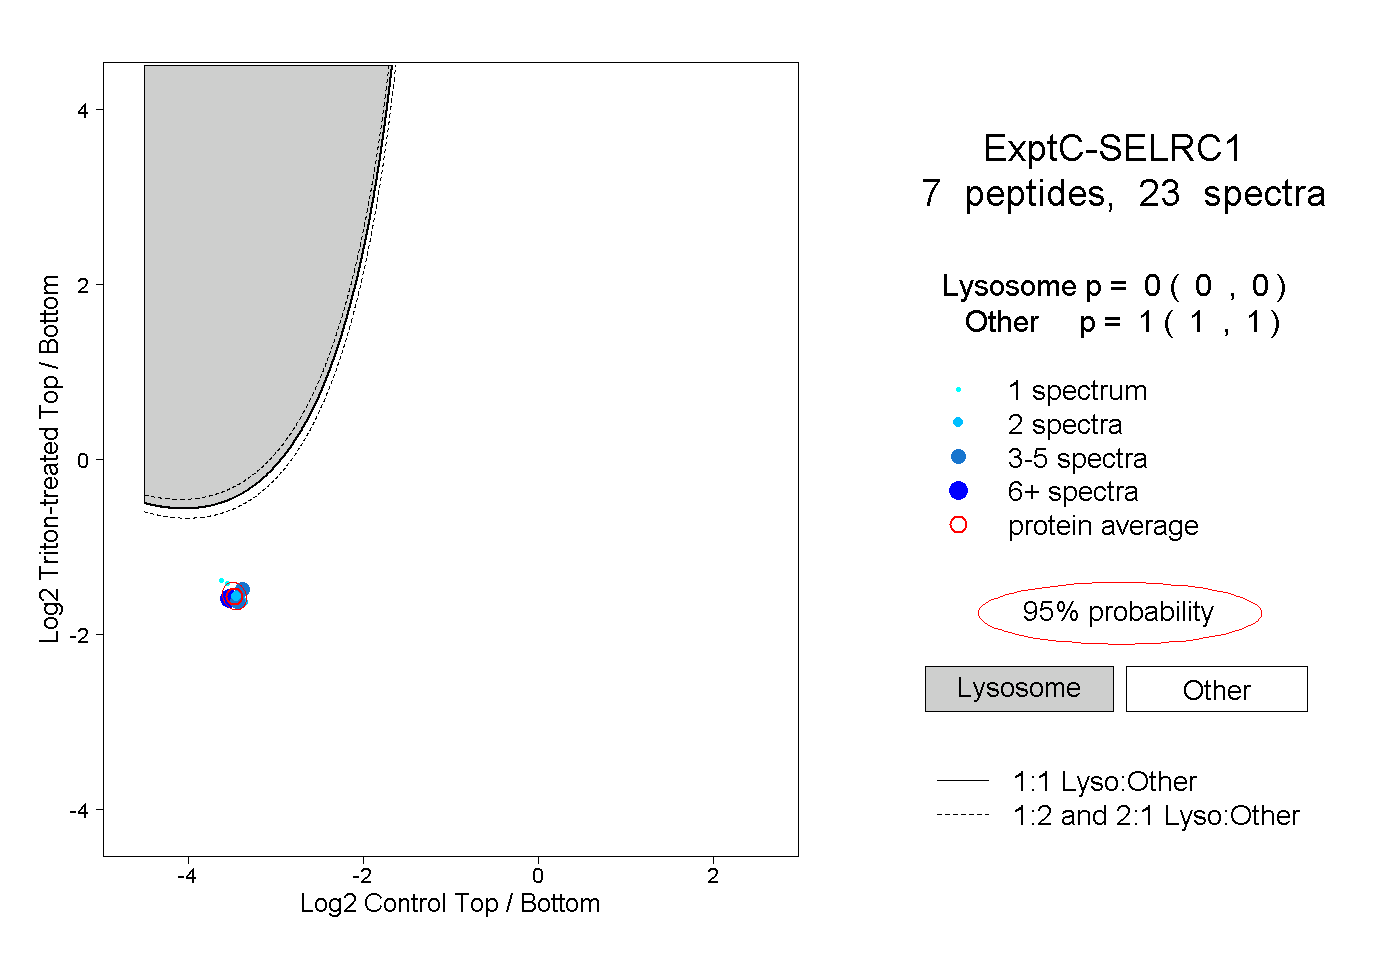
0.000 | 0.000
1.000 | 1.000
3peptides
spectra
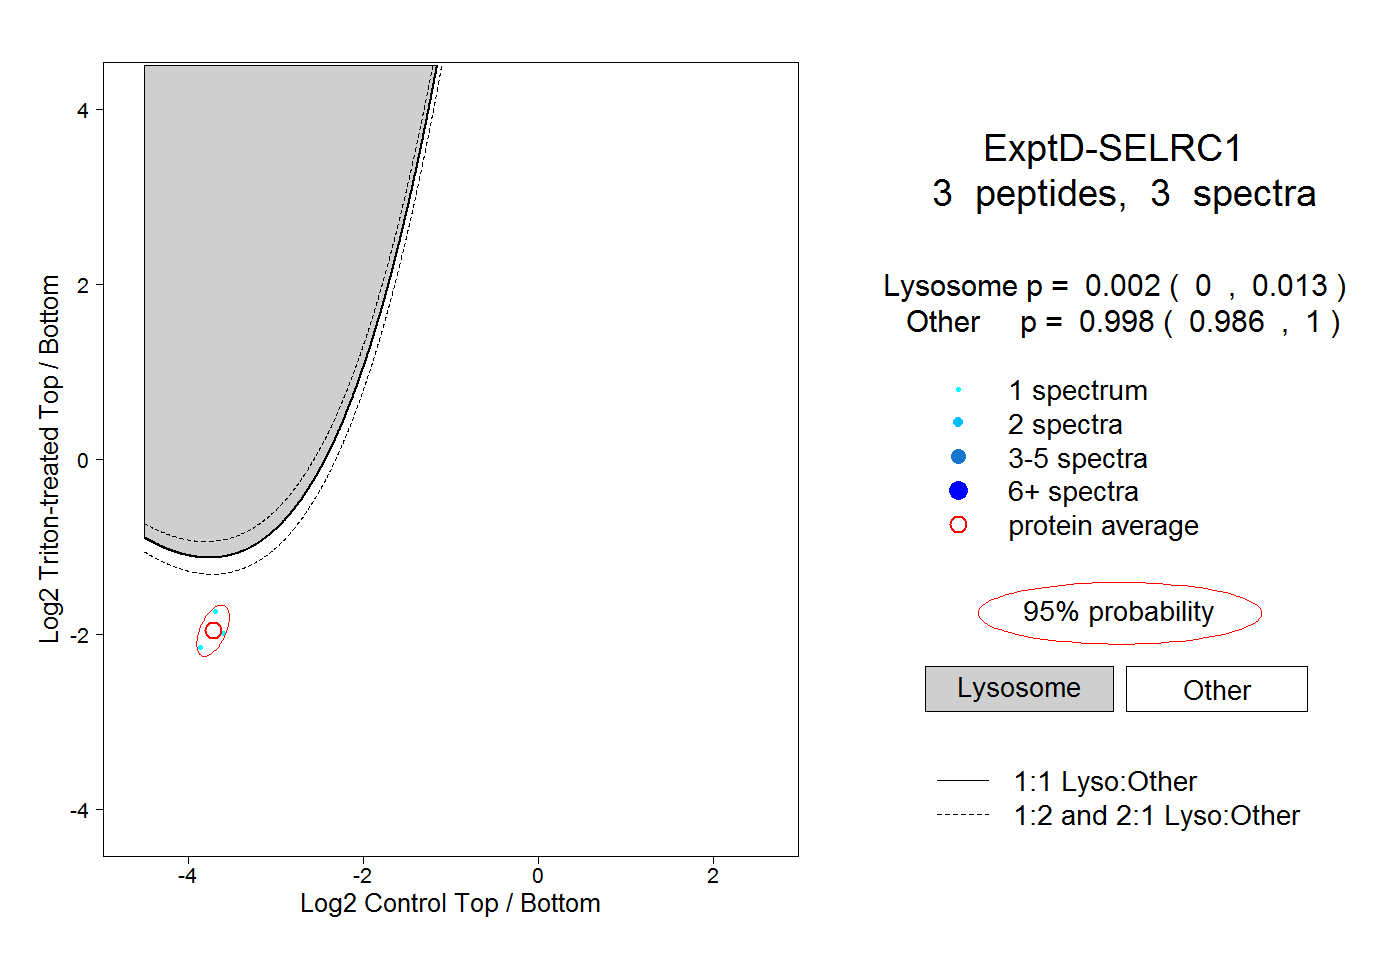
0.000 | 0.013
0.986 | 1.000