 3
3peptides
spectra
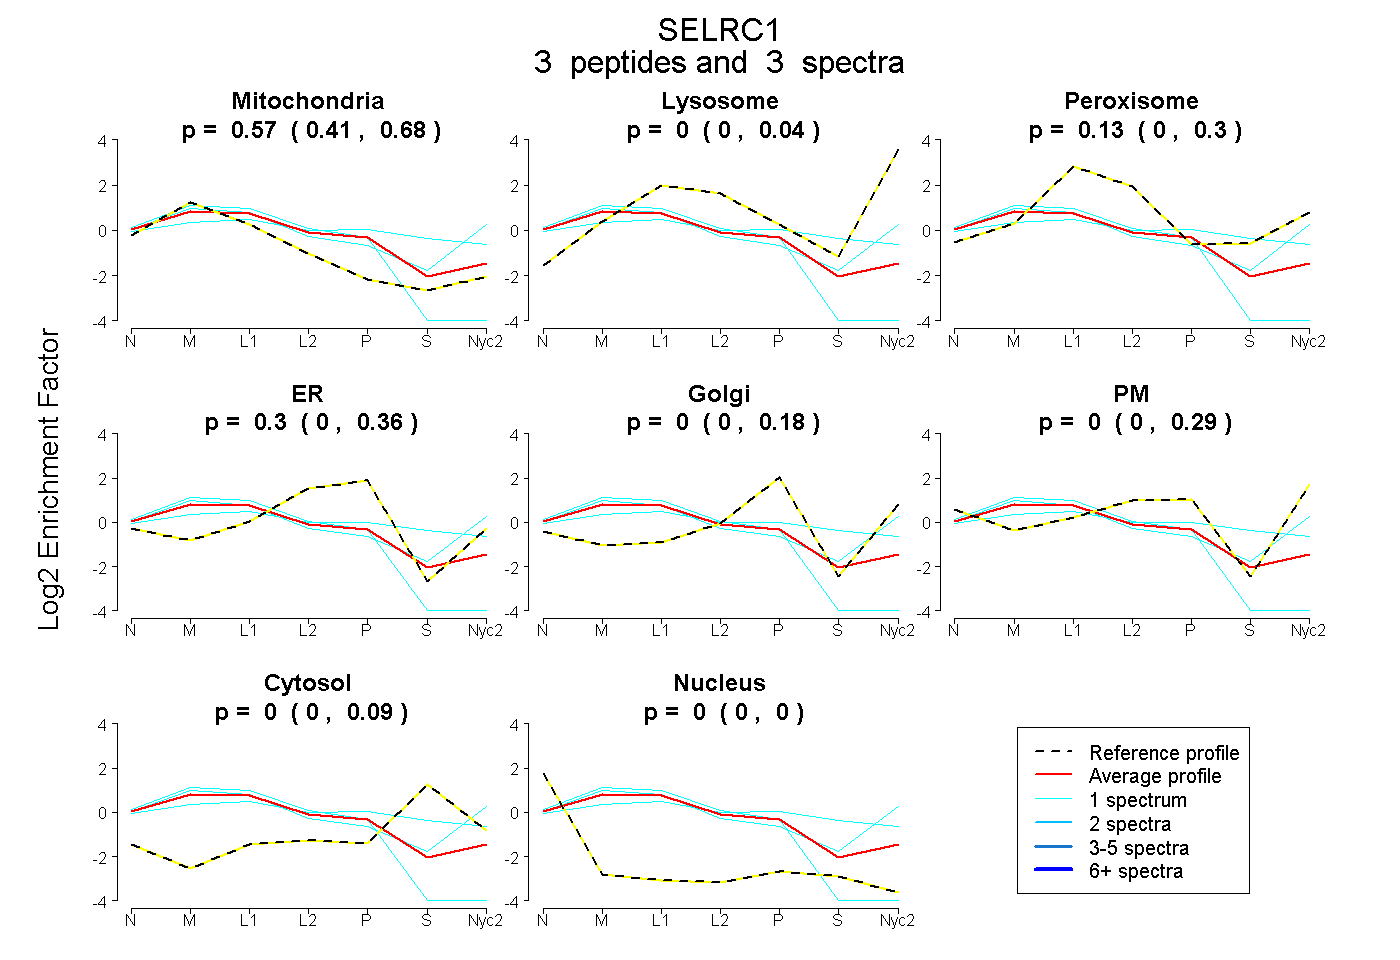
0.406 | 0.681
0.000 | 0.042
0.000 | 0.298
0.000 | 0.358
0.000 | 0.175
0.000 | 0.286
0.000 | 0.092
0.000 | 0.000
| Plot | Mito | Lyso | Perox | ER | Golgi | PM | Cytosol | Nucleus | |||||
| Expt A |
3 peptides |
3 spectra |
|
0.569 0.406 | 0.681 |
0.000 0.000 | 0.042 |
0.134 0.000 | 0.298 |
0.297 0.000 | 0.358 |
0.000 0.000 | 0.175 |
0.000 0.000 | 0.286 |
0.000 0.000 | 0.092 |
0.000 0.000 | 0.000 |
| 1 spectrum, GGLTQDLK | 0.248 | 0.000 | 0.335 | 0.024 | 0.189 | 0.000 | 0.203 | 0.000 | ||
| 1 spectrum, LGGYYVTGK | 0.502 | 0.201 | 0.048 | 0.000 | 0.000 | 0.243 | 0.006 | 0.000 | ||
| 1 spectrum, LVDYLEGIQK | 0.769 | 0.000 | 0.000 | 0.231 | 0.000 | 0.000 | 0.000 | 0.000 |
| Plot | Mito | Lyso or Perox | ER | Golgi | PM | Cytosol | Nucleus | ||||||
| Expt B |
1 peptide |
1 spectrum |
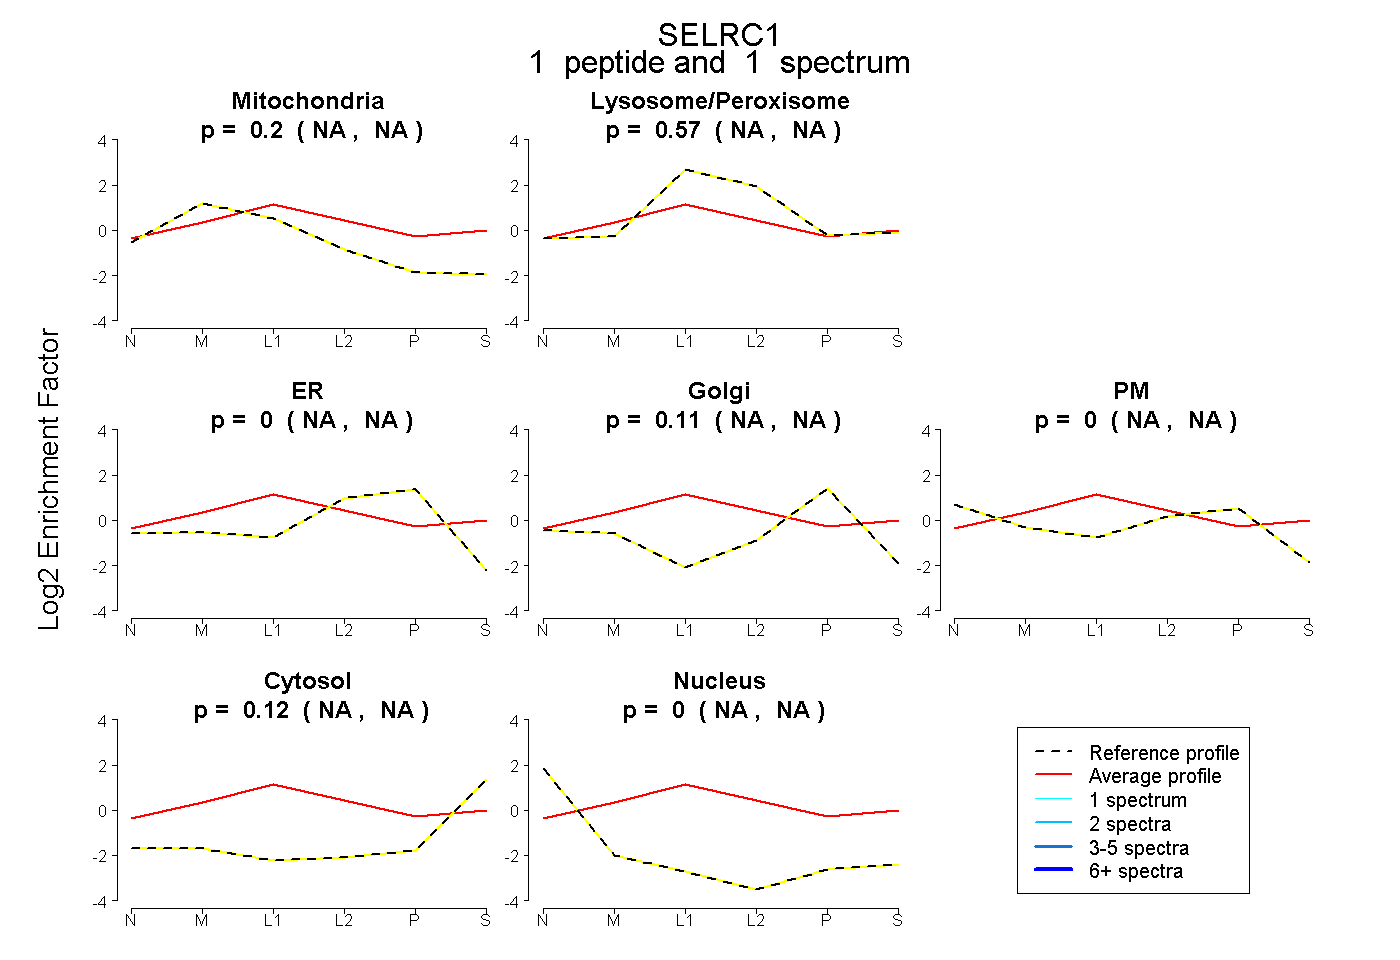 |
0.196 NA | NA |
0.575 NA | NA |
0.000 NA | NA |
0.105 NA | NA |
0.000 NA | NA |
0.124 NA | NA |
0.000 NA | NA |
|||
| Plot | Lyso | Other | |||||||||||
| Expt C |
7 peptides |
23 spectra |
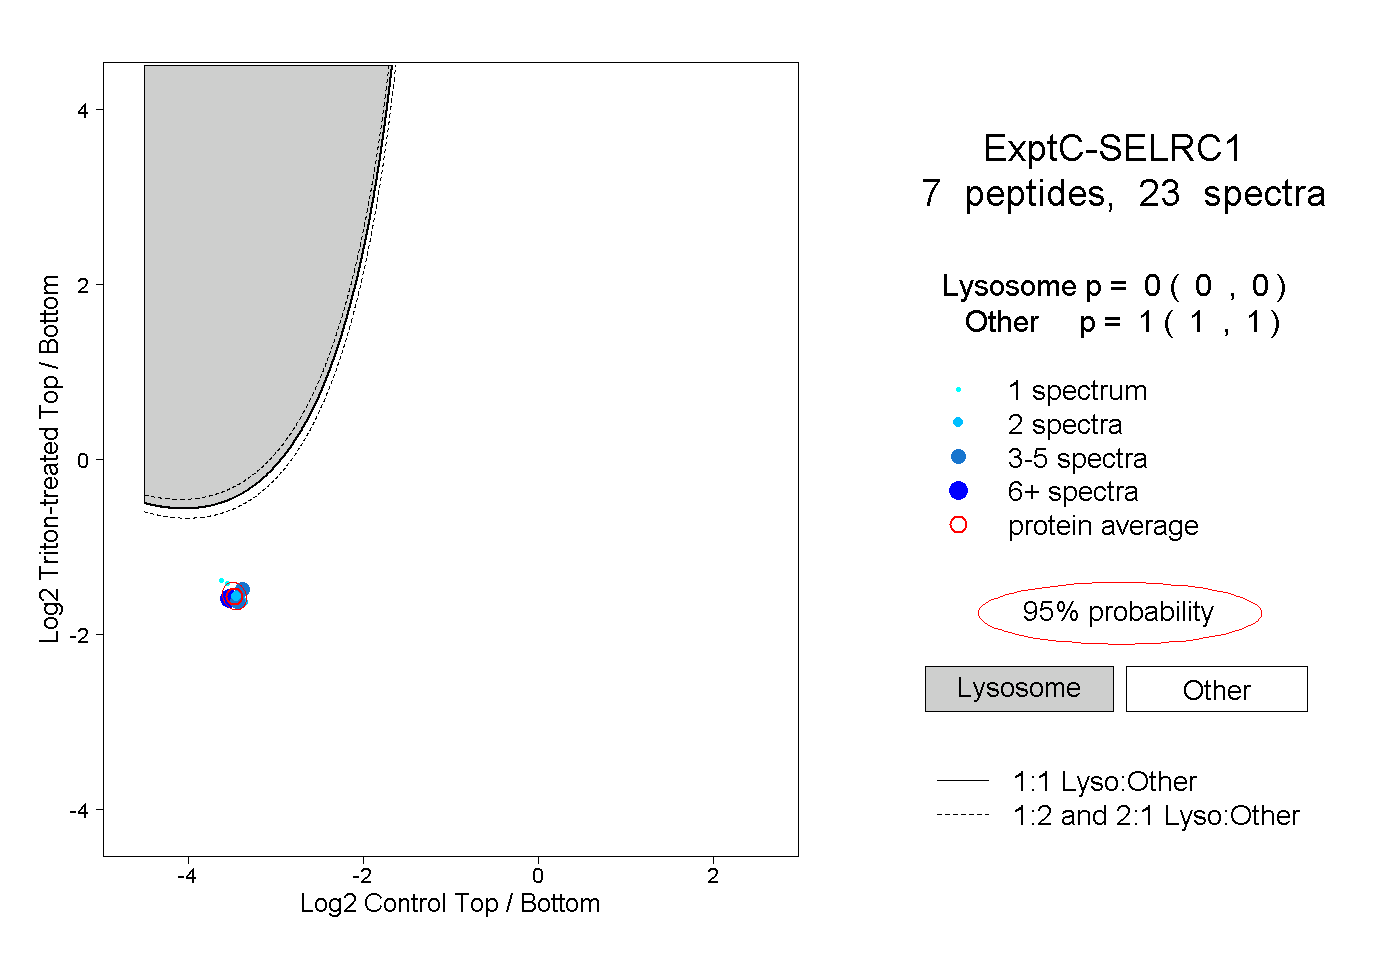 |
0.000 0.000 | 0.000 |
1.000 1.000 | 1.000 |
||||||||
| Plot | Lyso | Other | |||||||||||
| Expt D |
3 peptides |
3 spectra |
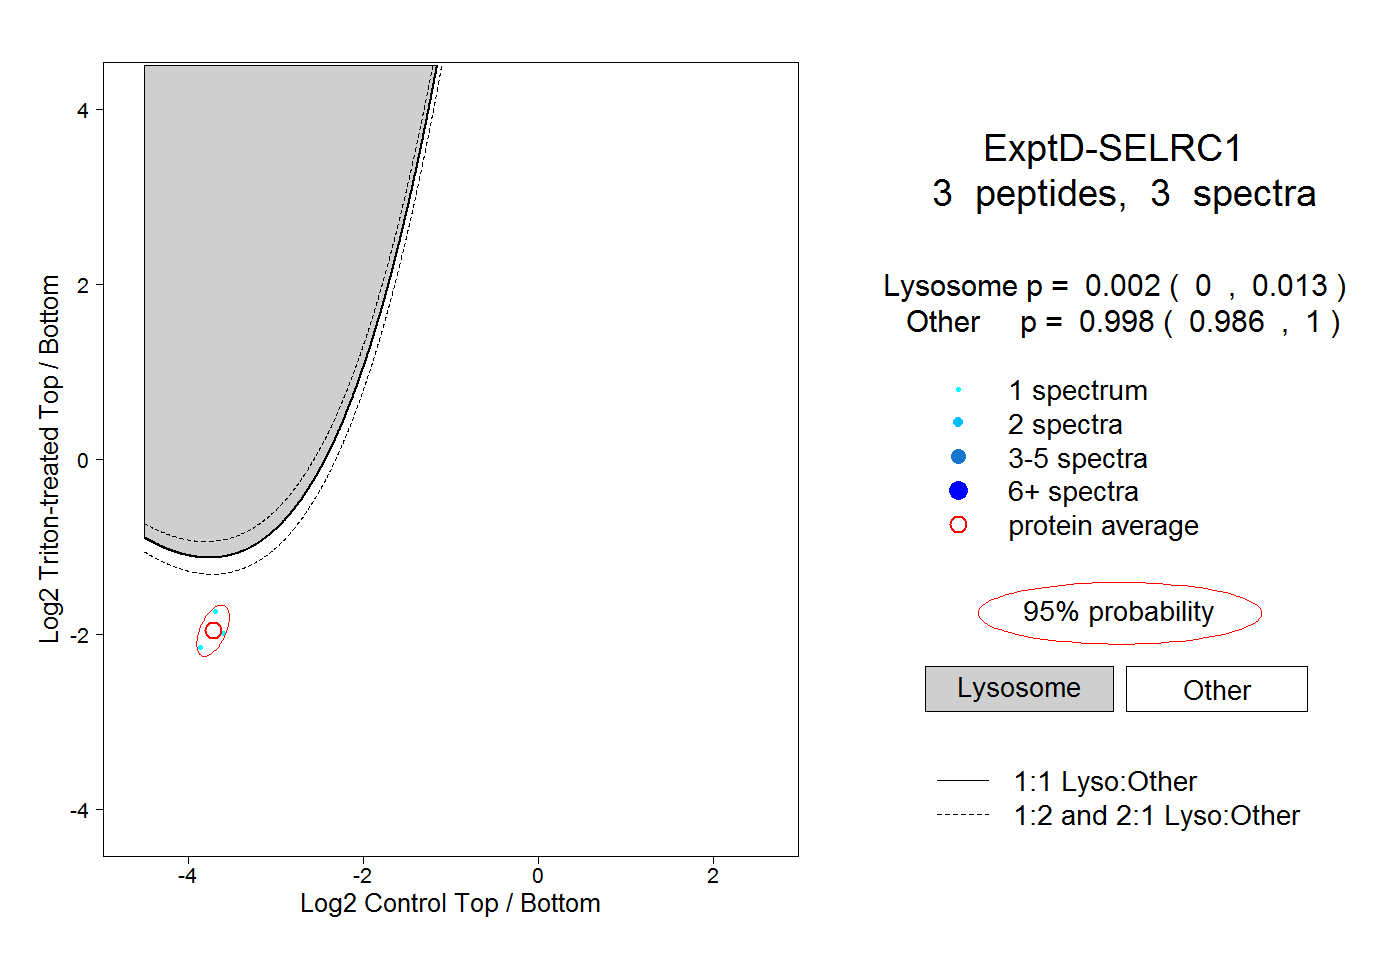 |
0.002 0.000 | 0.013 |
0.998 0.986 | 1.000 |