 5
5peptides
spectra
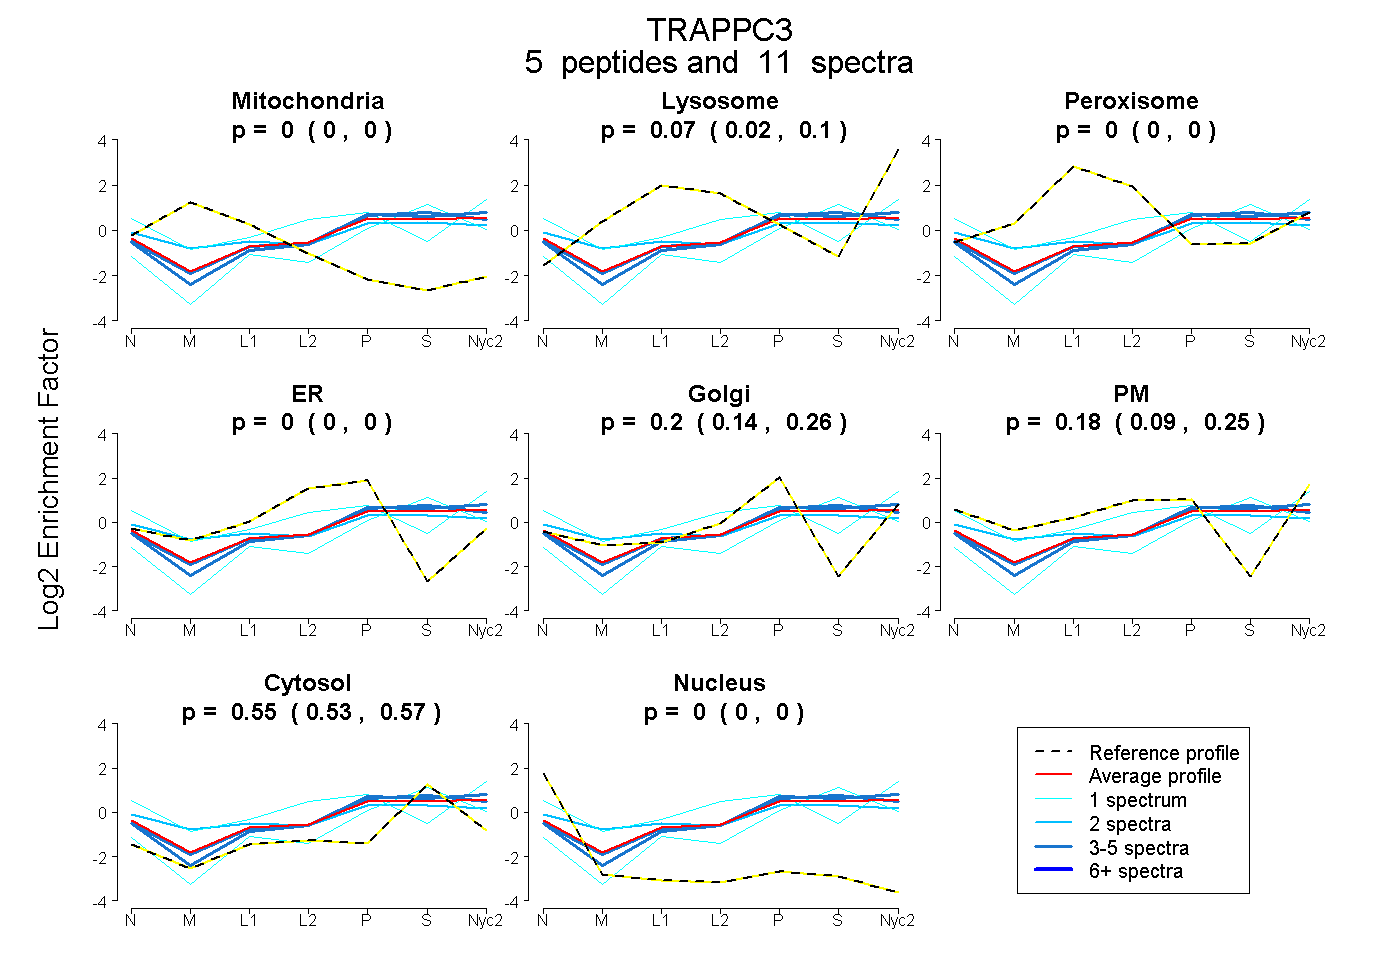
0.000 | 0.000
0.025 | 0.099
0.000 | 0.000
0.000 | 0.000
0.139 | 0.257
0.093 | 0.253
0.528 | 0.571
0.000 | 0.000
2peptides
spectra
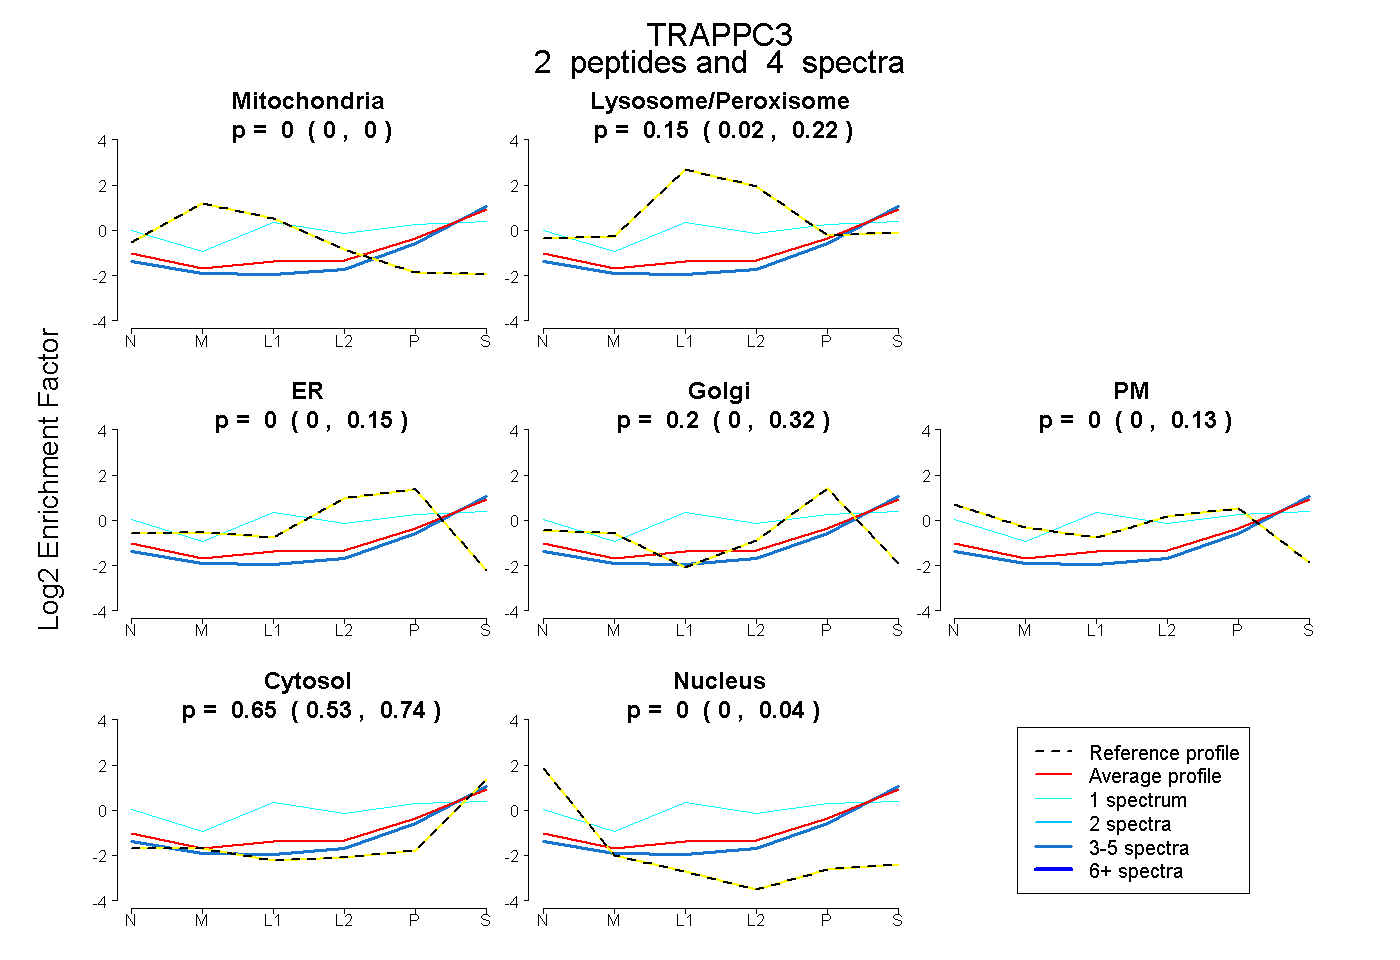
0.000 | 0.000
0.017 | 0.225
0.000 | 0.151
0.000 | 0.317
0.000 | 0.135
0.535 | 0.736
0.000 | 0.038
4peptides
spectra
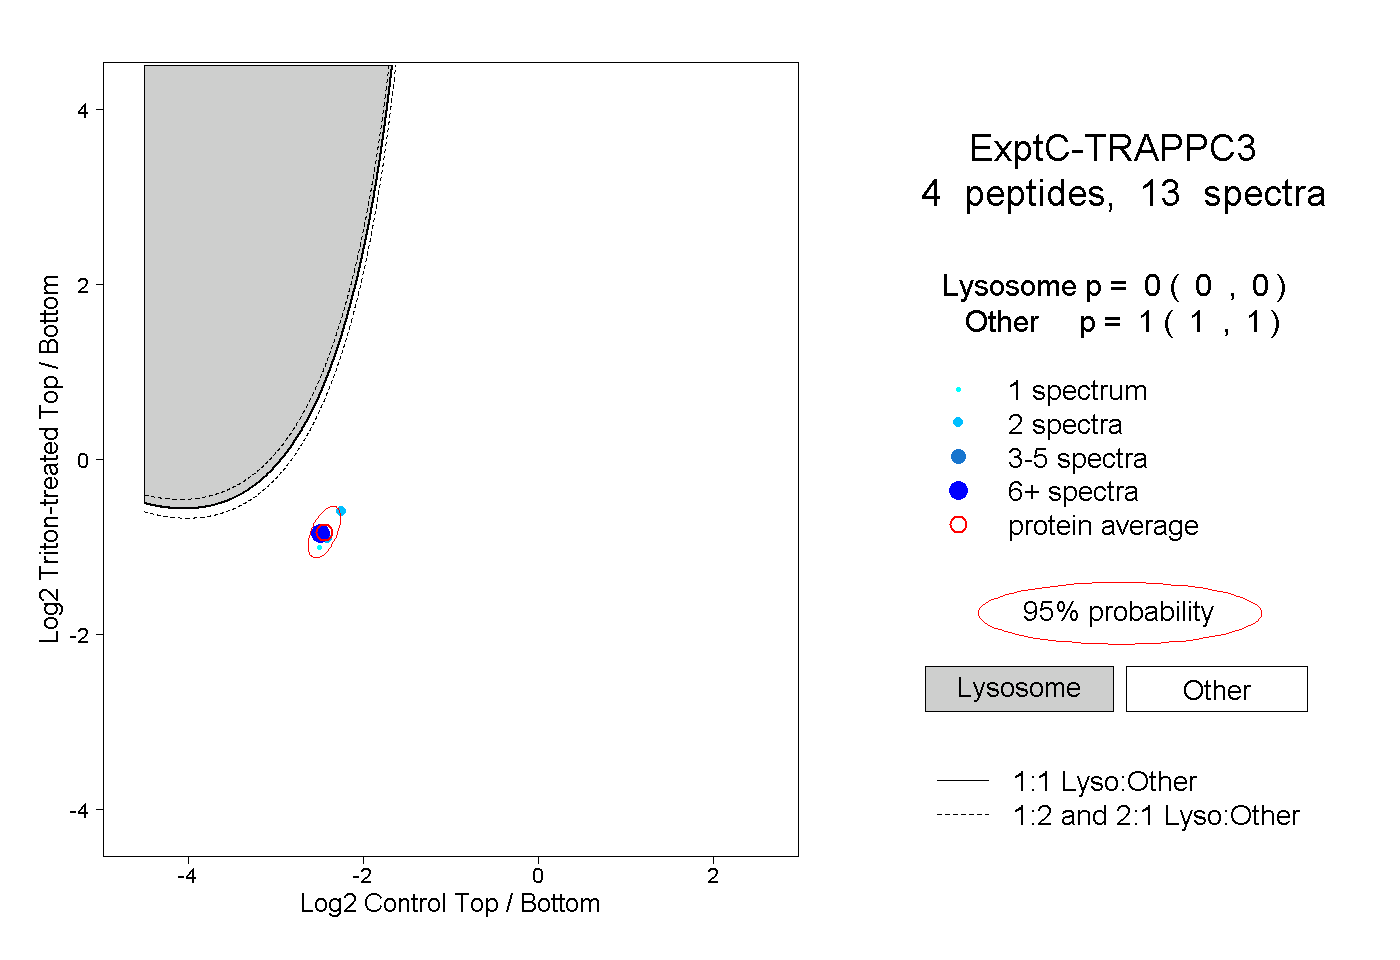
0.000 | 0.000
1.000 | 1.000