 5
5peptides
spectra
0.000 | 0.000
0.025 | 0.099
0.000 | 0.000
0.000 | 0.000
0.139 | 0.257
0.093 | 0.253
0.528 | 0.571
0.000 | 0.000
| Plot | Mito | Lyso | Perox | ER | Golgi | PM | Cytosol | Nucleus | |||||
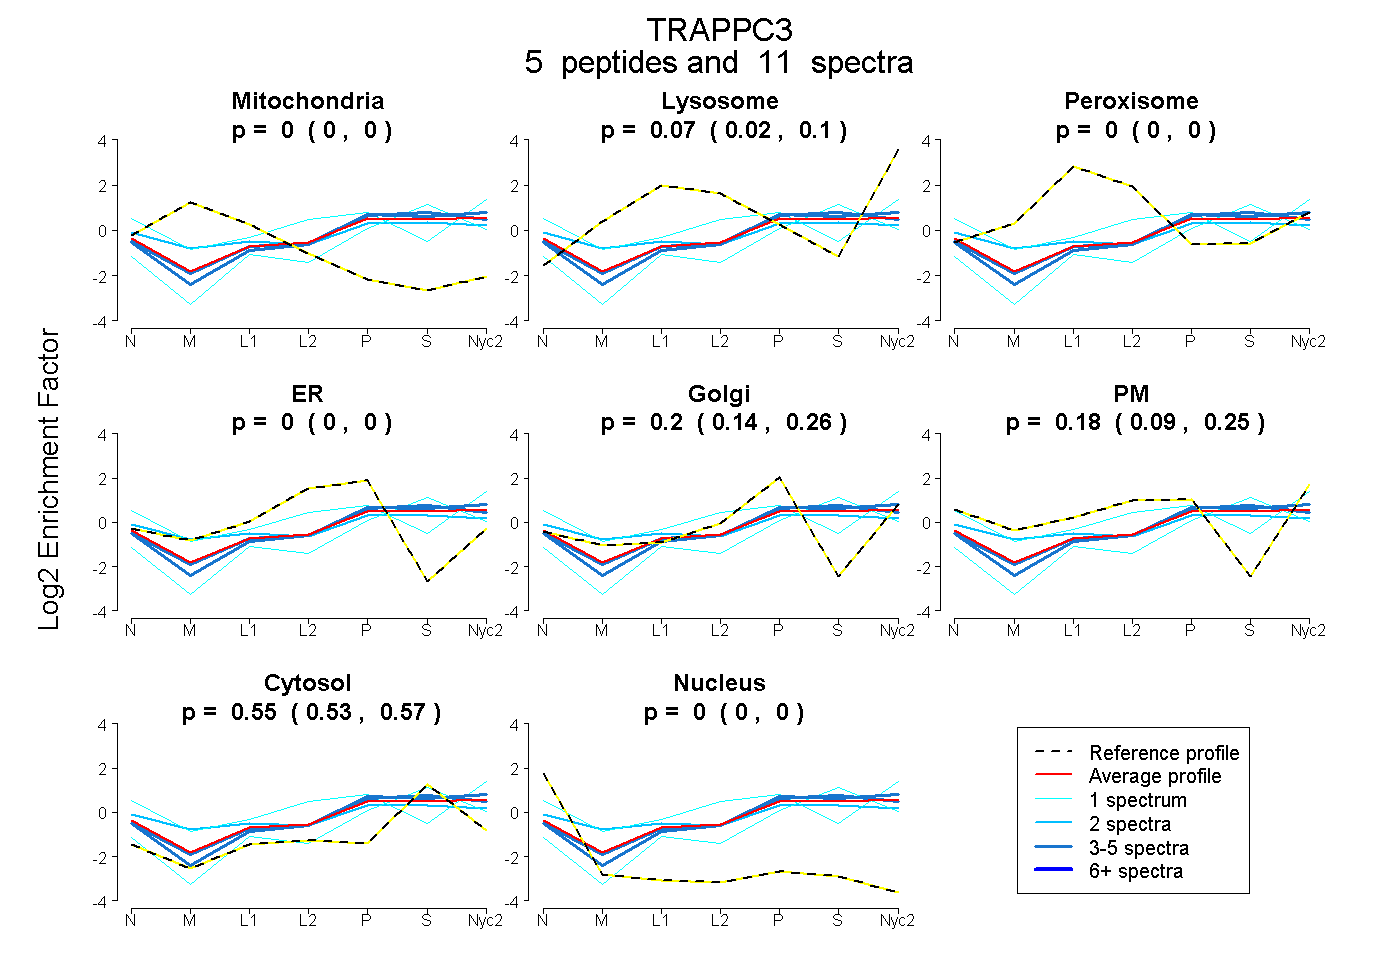
| Expt A |
5 peptides |
11 spectra |
|
0.000 0.000 | 0.000 |
0.067 0.025 | 0.099 |
0.000 0.000 | 0.000 |
0.000 0.000 | 0.000 |
0.203 0.139 | 0.257 |
0.179 0.093 | 0.253 |
0.551 0.528 | 0.571 |
0.000 0.000 | 0.000 |
| 4 spectra, MGYNIGVR | 0.000 | 0.139 | 0.000 | 0.000 | 0.314 | 0.015 | 0.532 | 0.000 | ||
| 1 spectrum, GDGVTEIR | 0.000 | 0.039 | 0.000 | 0.000 | 0.000 | 0.684 | 0.277 | 0.000 | ||
| 2 spectra, ETADVIAK | 0.000 | 0.000 | 0.103 | 0.000 | 0.137 | 0.265 | 0.496 | 0.000 | ||
| 1 spectrum, GALEMVQMAVEAK | 0.000 | 0.000 | 0.000 | 0.000 | 0.189 | 0.000 | 0.811 | 0.000 | ||
| 3 spectra, LIEDFLAR | 0.000 | 0.072 | 0.000 | 0.000 | 0.327 | 0.001 | 0.600 | 0.000 |
| Plot | Mito | Lyso or Perox | ER | Golgi | PM | Cytosol | Nucleus | ||||||
| Expt B |
2 peptides |
4 spectra |
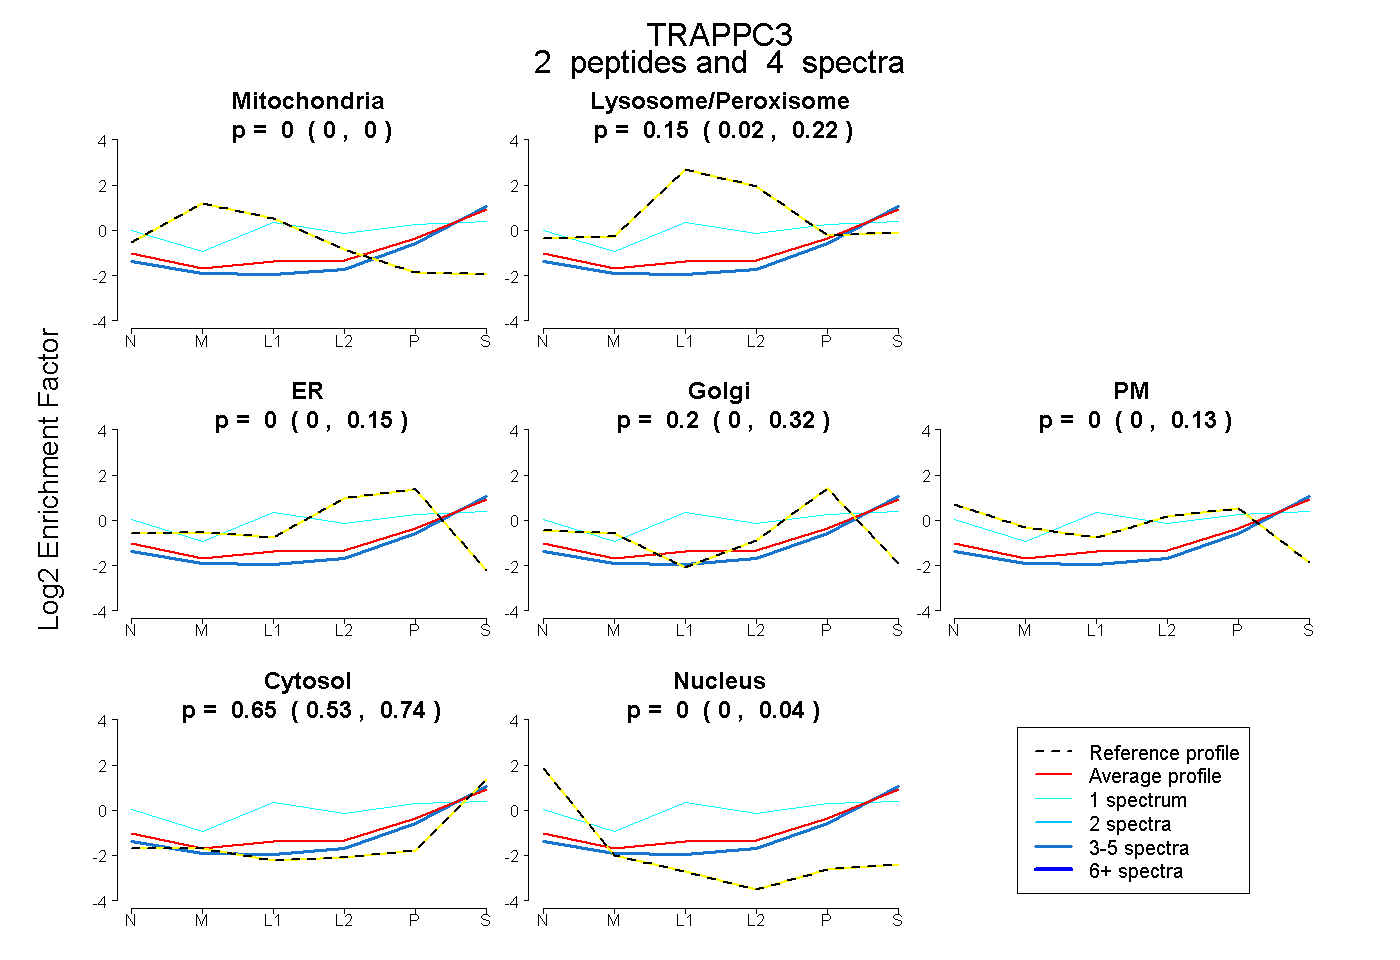 |
0.000 0.000 | 0.000 |
0.148 0.017 | 0.225 |
0.000 0.000 | 0.151 |
0.205 0.000 | 0.317 |
0.000 0.000 | 0.135 |
0.647 0.535 | 0.736 |
0.000 0.000 | 0.038 |
|||
| Plot | Lyso | Other | |||||||||||
| Expt C |
4 peptides |
13 spectra |
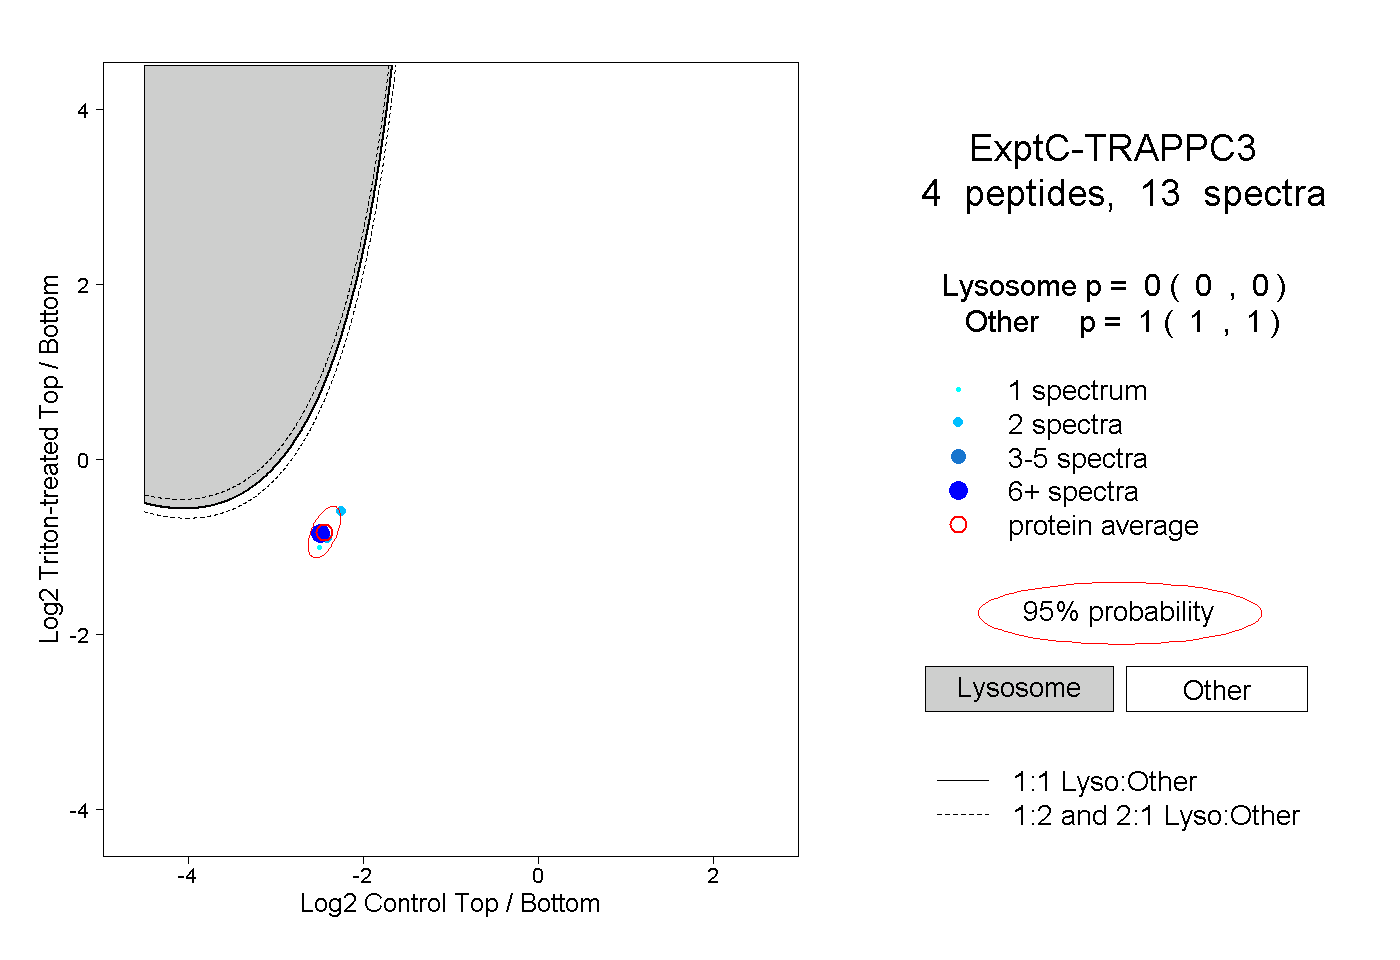 |
0.000 0.000 | 0.000 |
1.000 1.000 | 1.000 |