 9
9peptides
spectra

0.000 | 0.000
0.000 | 0.000
0.000 | 0.000
0.000 | 0.069
0.142 | 0.242
0.000 | 0.000
0.682 | 0.696
0.064 | 0.089
5peptides
spectra
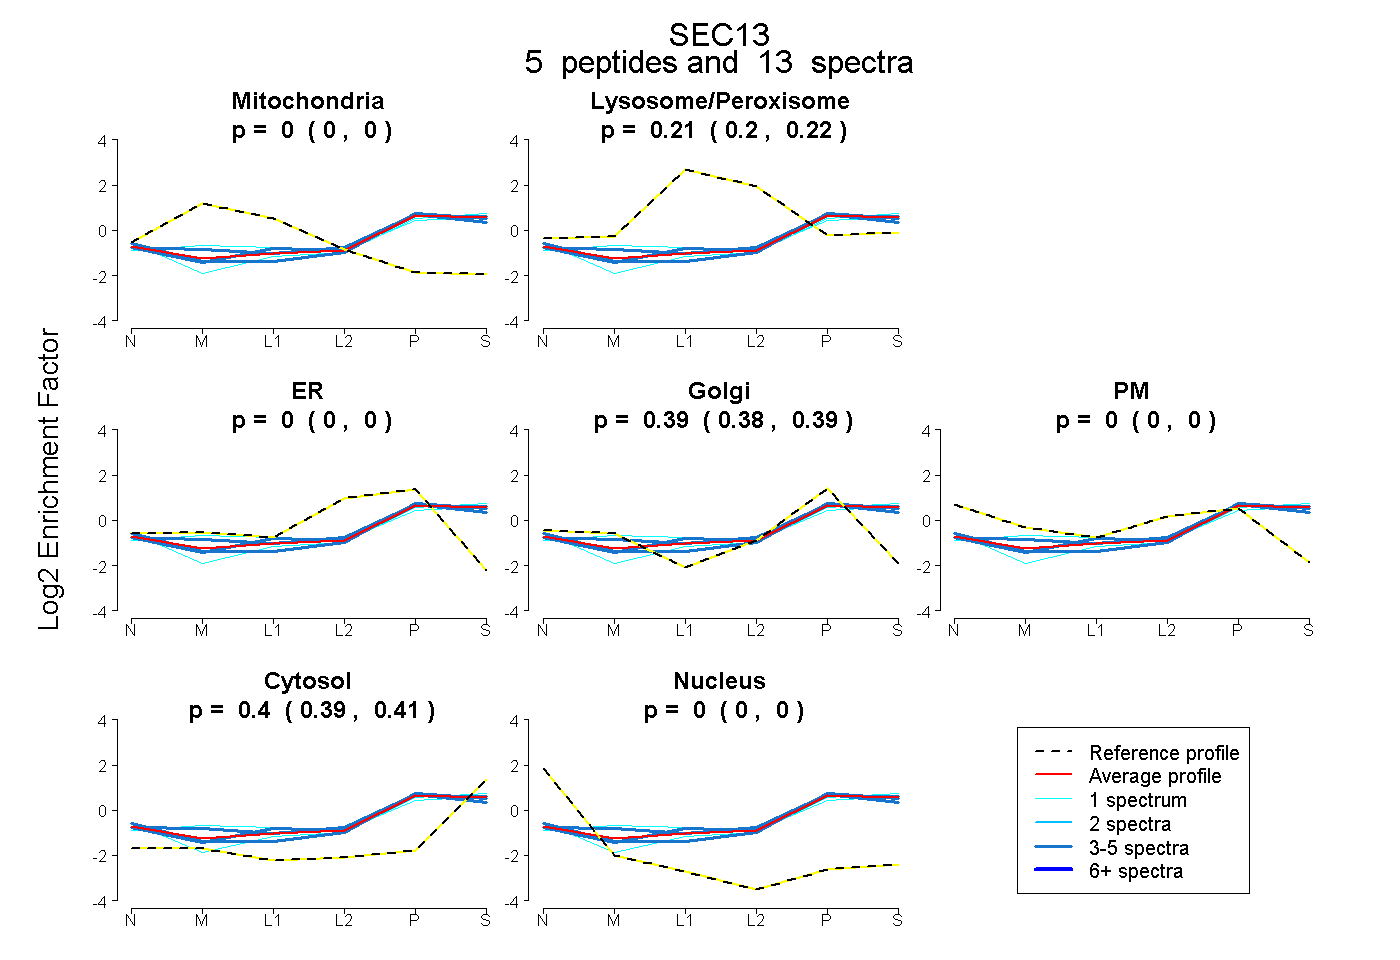
0.000 | 0.000
0.205 | 0.222
0.000 | 0.000
0.377 | 0.395
0.000 | 0.000
0.392 | 0.406
0.000 | 0.000
5peptides
spectra
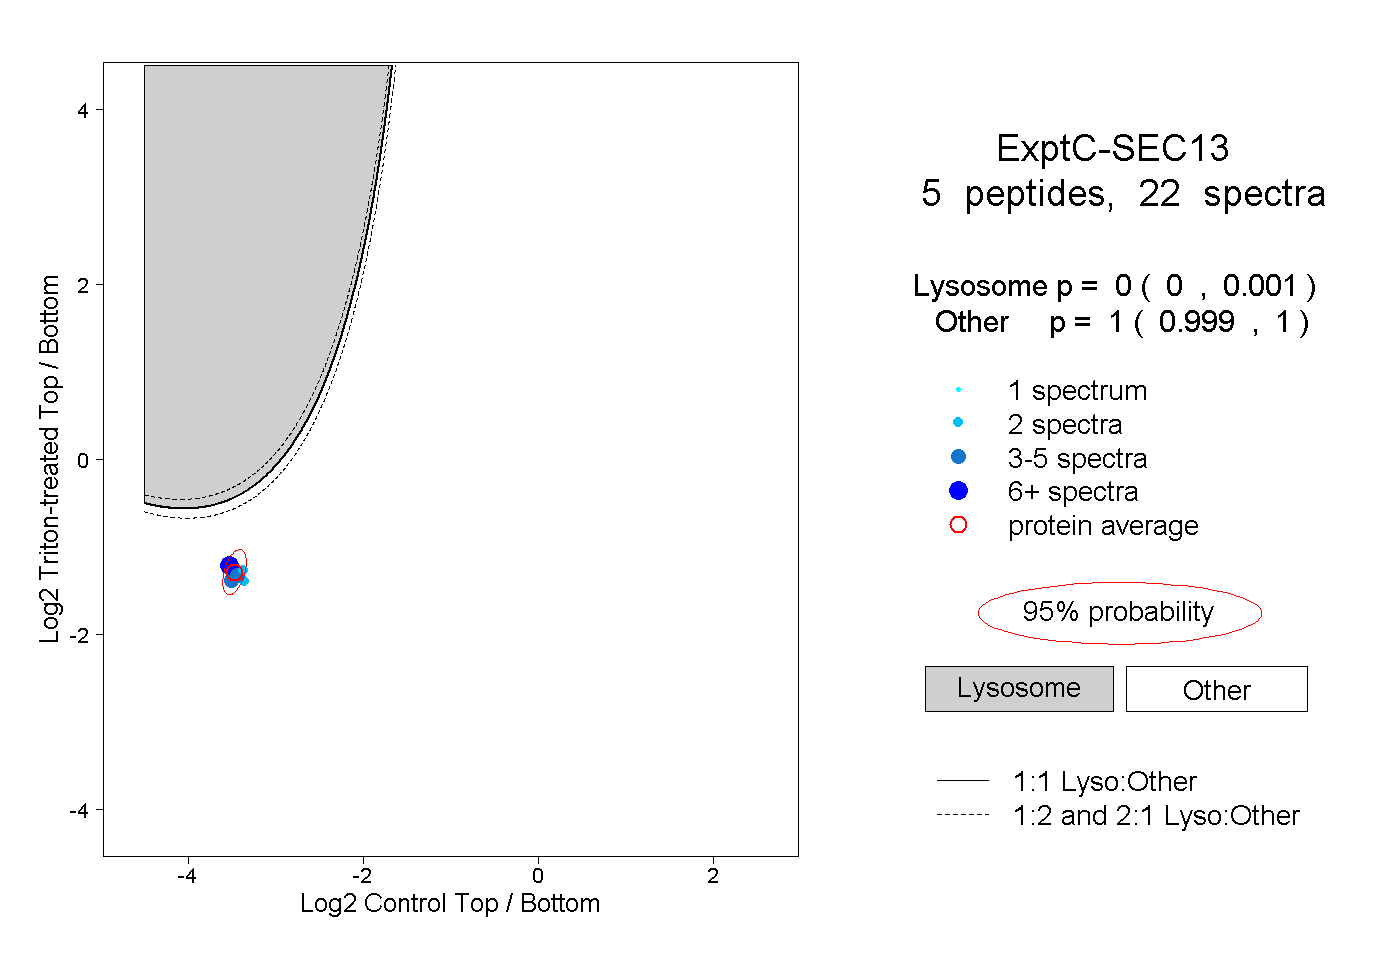
0.000 | 0.001
0.999 | 1.000
1peptide
spectrum
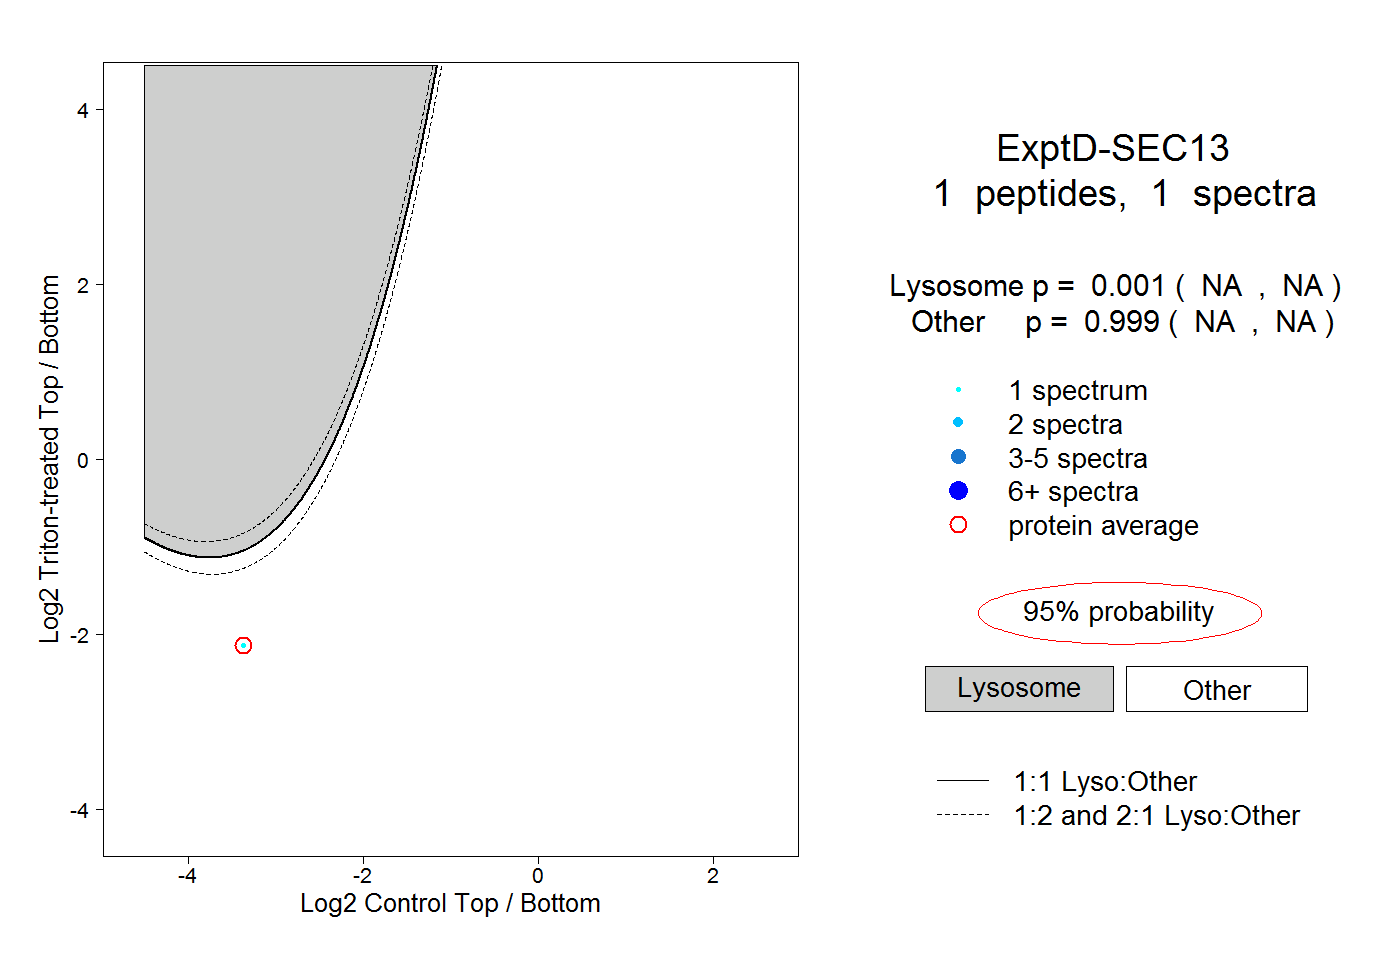
NA | NA
NA | NA