 9
9peptides
spectra

0.000 | 0.000
0.000 | 0.000
0.000 | 0.000
0.000 | 0.069
0.142 | 0.242
0.000 | 0.000
0.682 | 0.696
0.064 | 0.089
| Plot | Mito | Lyso | Perox | ER | Golgi | PM | Cytosol | Nucleus | |||||
| Expt A |
9 peptides |
28 spectra |
|
0.000 0.000 | 0.000 |
0.000 0.000 | 0.000 |
0.000 0.000 | 0.000 |
0.027 0.000 | 0.069 |
0.205 0.142 | 0.242 |
0.000 0.000 | 0.000 |
0.690 0.682 | 0.696 |
0.078 0.064 | 0.089 |
| 1 spectrum, VFIWTCDDASGNMWSPK | 0.000 | 0.000 | 0.000 | 0.069 | 0.000 | 0.000 | 0.668 | 0.262 | ||
| 4 spectra, LEAHSDWVR | 0.000 | 0.000 | 0.000 | 0.000 | 0.317 | 0.000 | 0.683 | 0.000 | ||
| 6 spectra, FASGGCDNLIK | 0.000 | 0.000 | 0.000 | 0.000 | 0.274 | 0.000 | 0.685 | 0.040 | ||
| 3 spectra, ESVDGQWVCISDVNK | 0.000 | 0.000 | 0.000 | 0.015 | 0.000 | 0.000 | 0.783 | 0.203 | ||
| 6 spectra, LATCSSDR | 0.000 | 0.000 | 0.033 | 0.000 | 0.356 | 0.000 | 0.612 | 0.000 | ||
| 2 spectra, EEEDGQWK | 0.000 | 0.000 | 0.000 | 0.000 | 0.148 | 0.000 | 0.789 | 0.063 | ||
| 1 spectrum, GQGSVSASITEGQQNEQ | 0.000 | 0.000 | 0.000 | 0.058 | 0.000 | 0.000 | 0.551 | 0.391 | ||
| 4 spectra, NGGQILIADLR | 0.000 | 0.000 | 0.050 | 0.116 | 0.323 | 0.000 | 0.512 | 0.000 | ||
| 1 spectrum, EENGTWEK | 0.061 | 0.000 | 0.000 | 0.000 | 0.267 | 0.000 | 0.644 | 0.028 |
| Plot | Mito | Lyso or Perox | ER | Golgi | PM | Cytosol | Nucleus | ||||||
| Expt B |
5 peptides |
13 spectra |
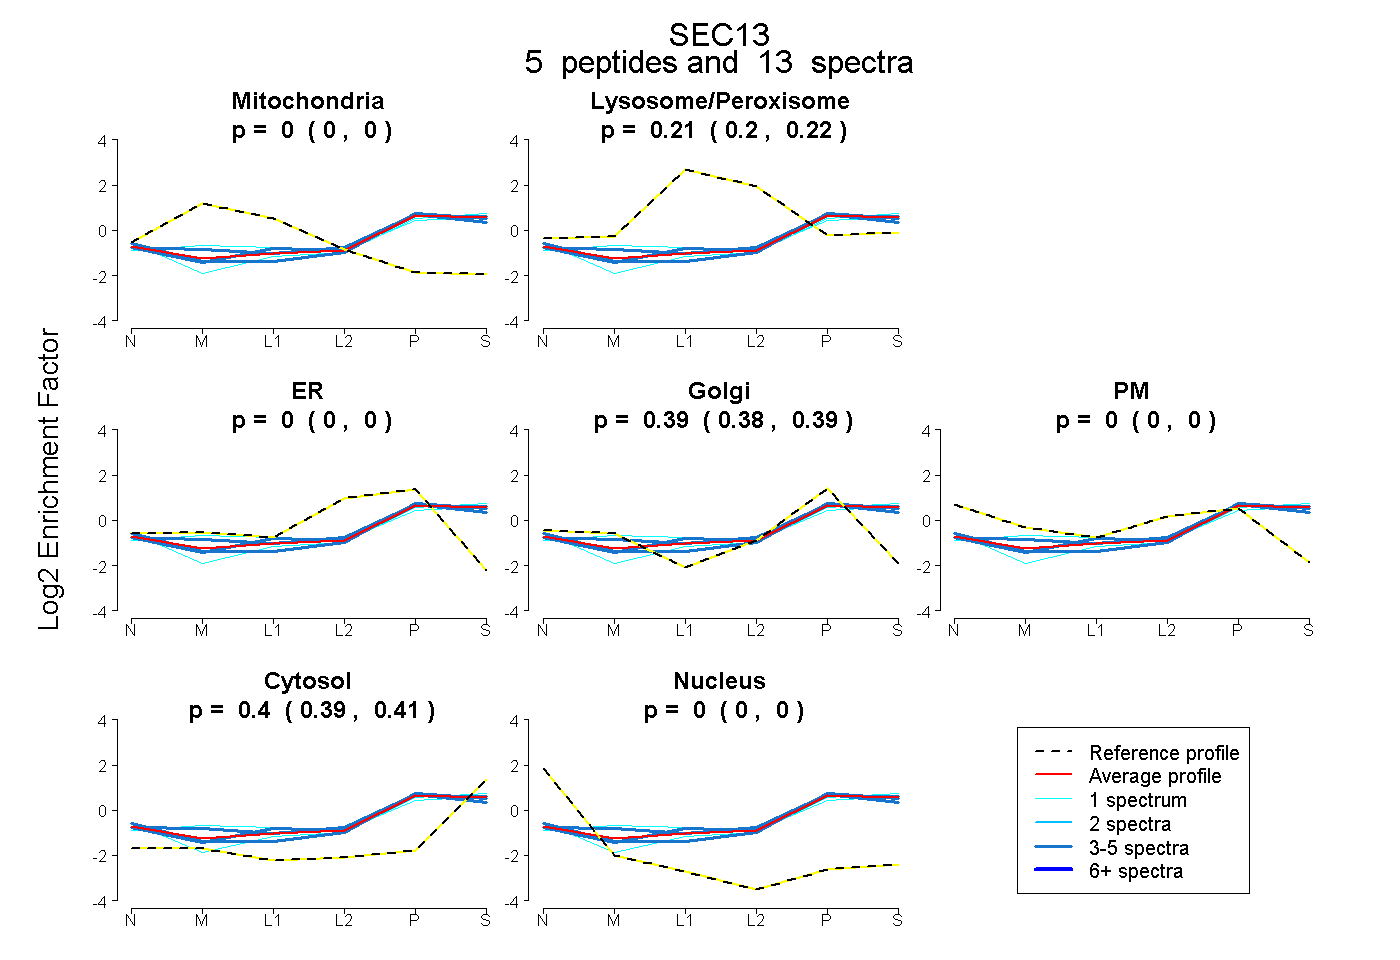 |
0.000 0.000 | 0.000 |
0.214 0.205 | 0.222 |
0.000 0.000 | 0.000 |
0.387 0.377 | 0.395 |
0.000 0.000 | 0.000 |
0.400 0.392 | 0.406 |
0.000 0.000 | 0.000 |
|||
| Plot | Lyso | Other | |||||||||||
| Expt C |
5 peptides |
22 spectra |
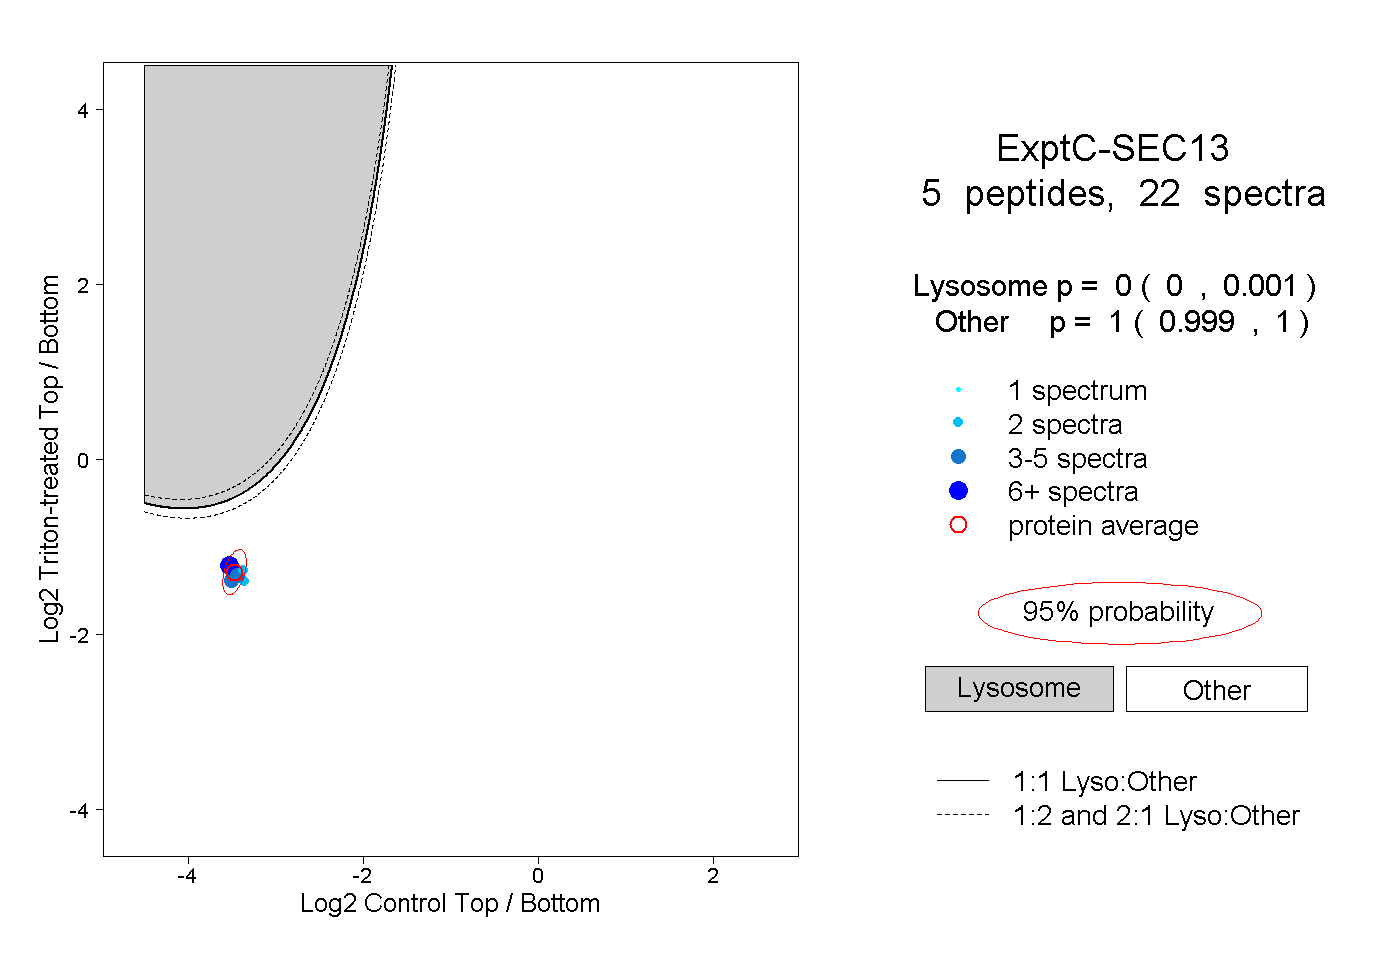 |
0.000 0.000 | 0.001 |
1.000 0.999 | 1.000 |
||||||||
| Plot | Lyso | Other | |||||||||||
| Expt D |
1 peptide |
1 spectrum |
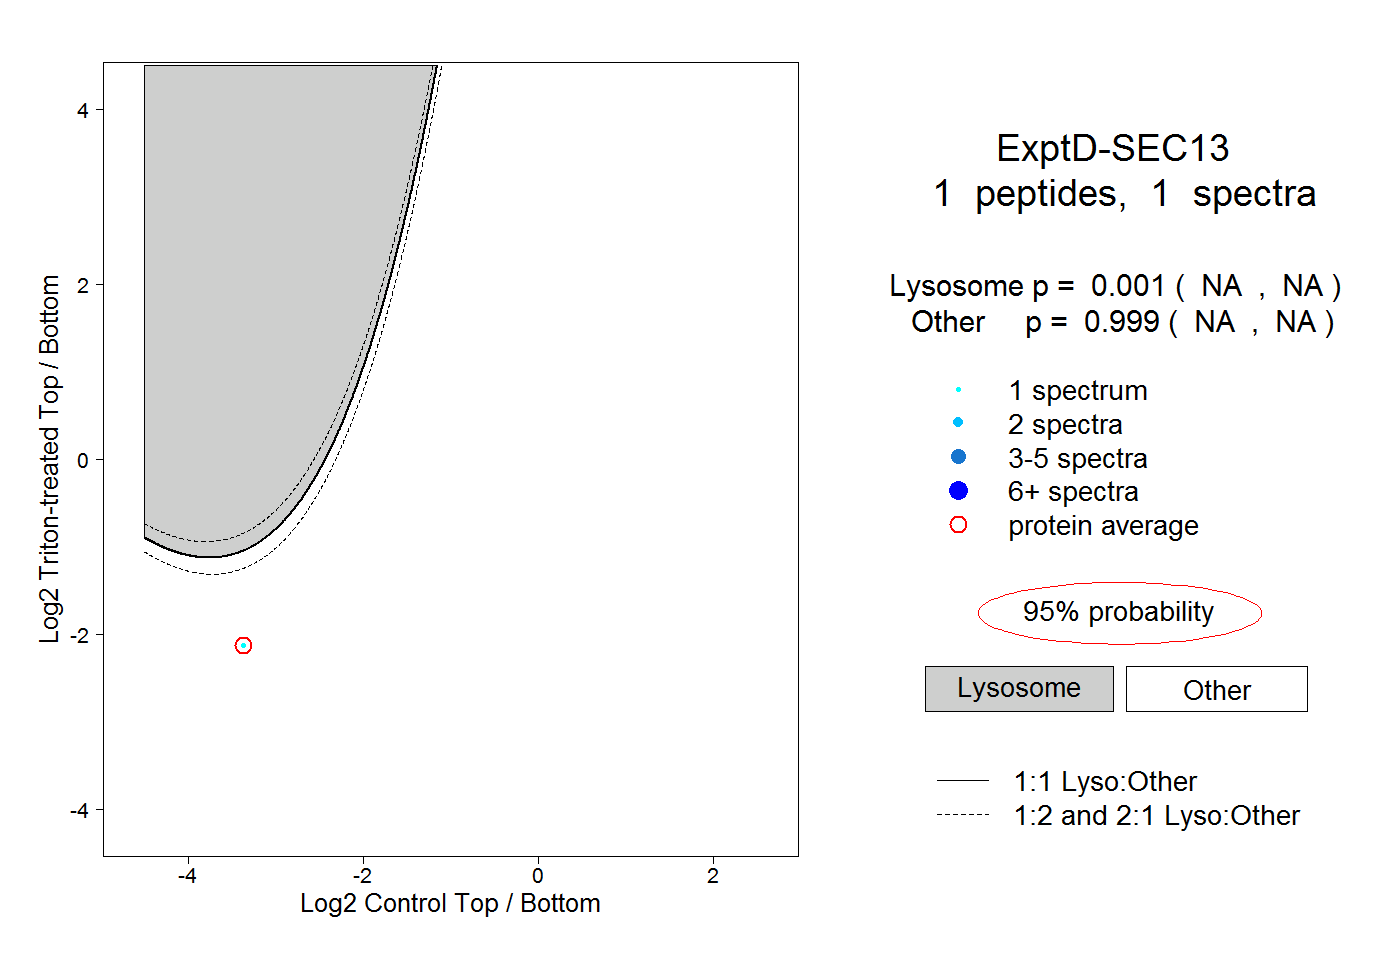 |
0.001 NA | NA |
0.999 NA | NA |