 5
5peptides
spectra
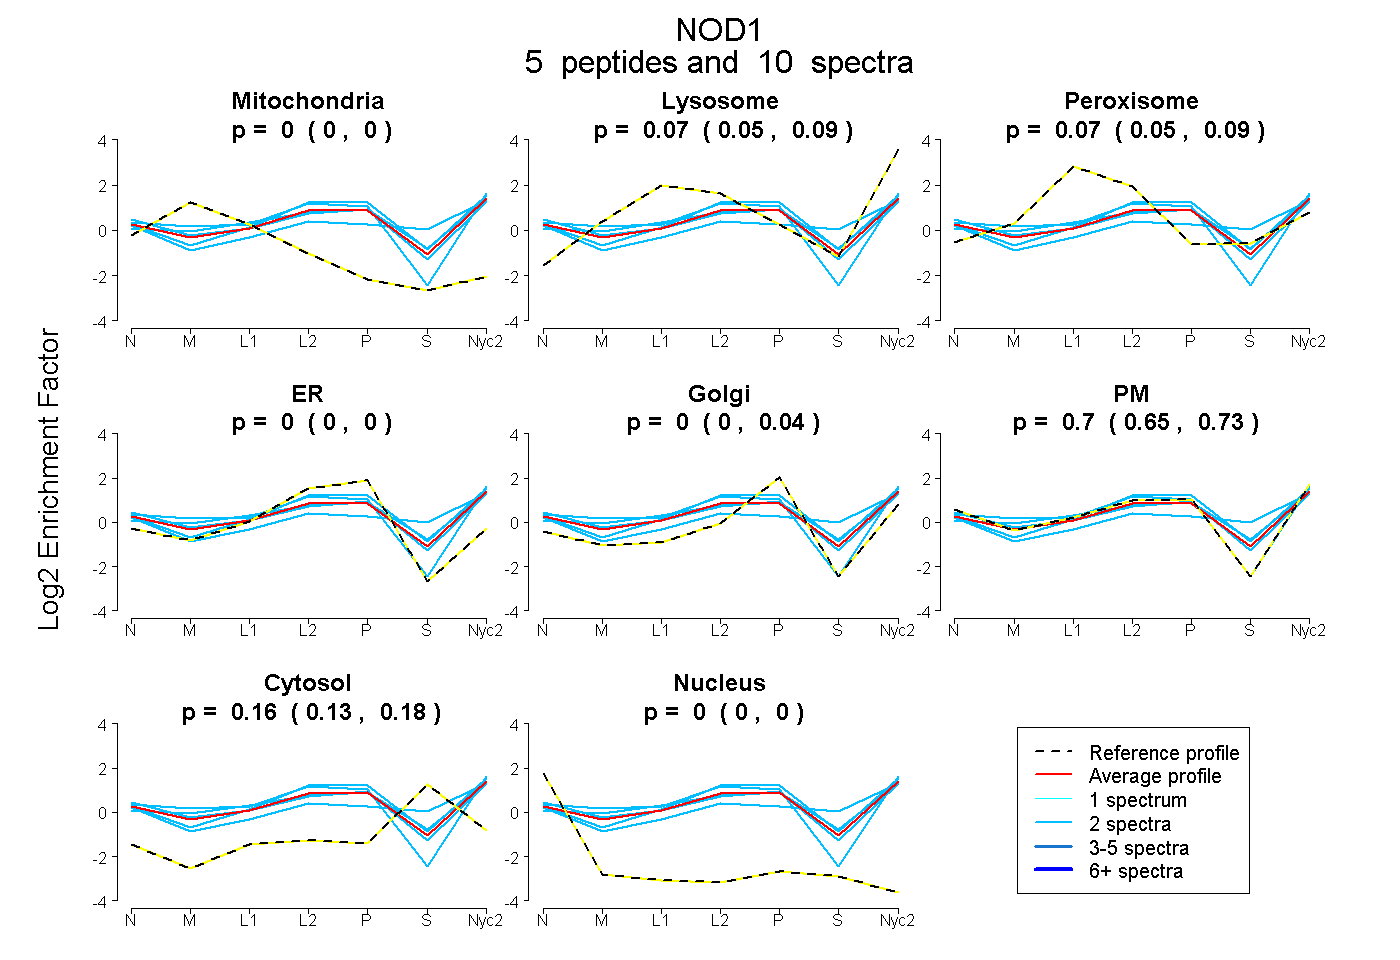
0.000 | 0.000
0.053 | 0.092
0.047 | 0.092
0.000 | 0.000
0.000 | 0.037
0.645 | 0.728
0.129 | 0.176
0.000 | 0.000
1peptide
spectrum

NA | NA
NA | NA
NA | NA
NA | NA
NA | NA
NA | NA
NA | NA
6peptides
spectra
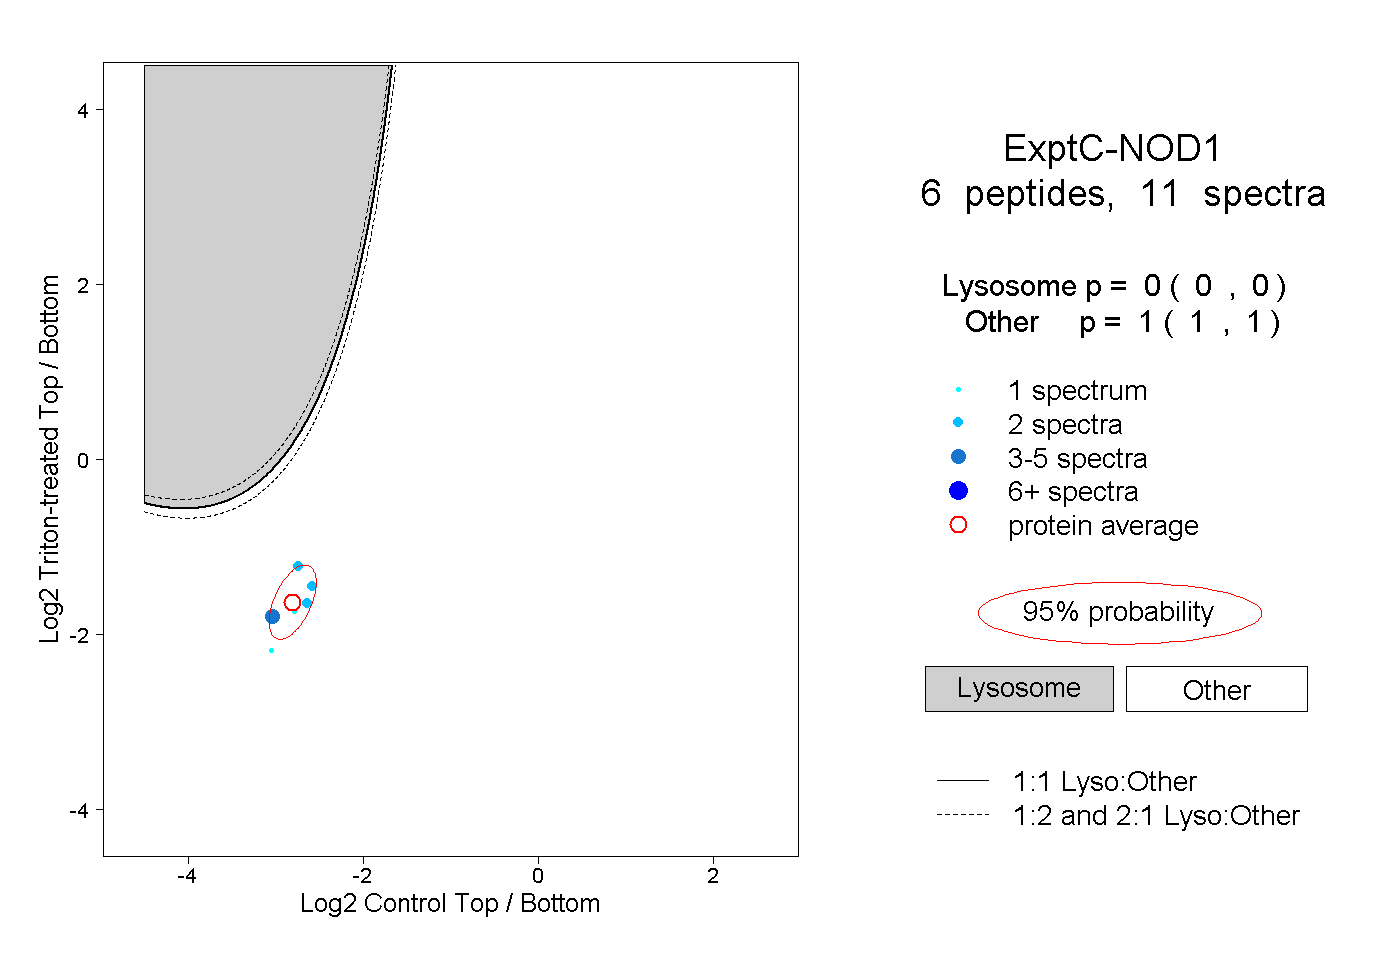
0.000 | 0.000
1.000 | 1.000
1peptide
spectrum
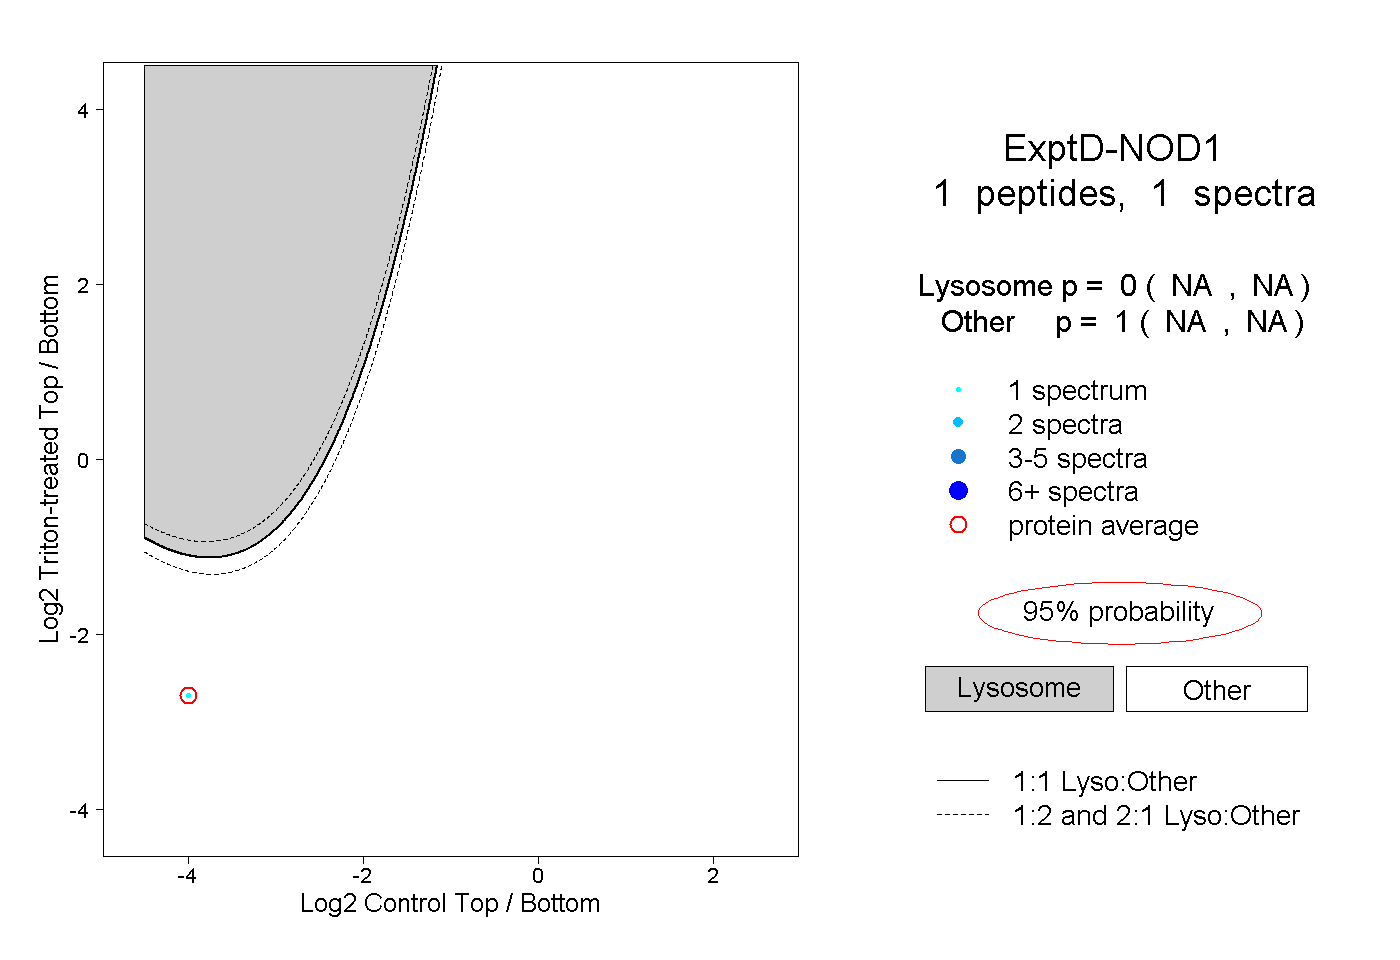
NA | NA
NA | NA