 5
5peptides
spectra
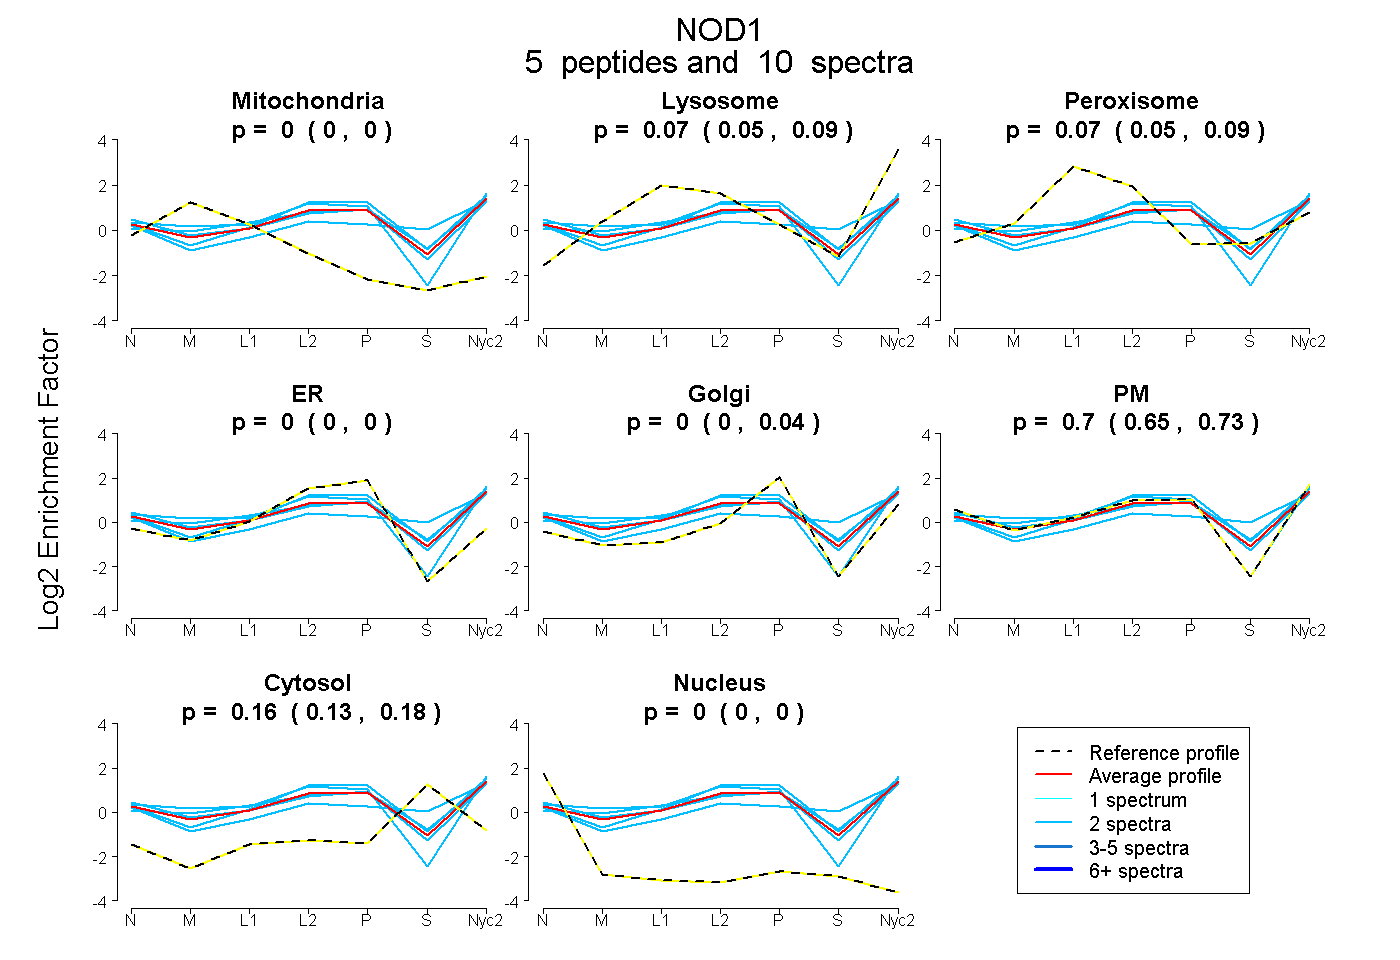
0.000 | 0.000
0.053 | 0.092
0.047 | 0.092
0.000 | 0.000
0.000 | 0.037
0.645 | 0.728
0.129 | 0.176
0.000 | 0.000
| Plot | Mito | Lyso | Perox | ER | Golgi | PM | Cytosol | Nucleus | |||||
| Expt A |
5 peptides |
10 spectra |
|
0.000 0.000 | 0.000 |
0.074 0.053 | 0.092 |
0.070 0.047 | 0.092 |
0.000 0.000 | 0.000 |
0.000 0.000 | 0.037 |
0.699 0.645 | 0.728 |
0.157 0.129 | 0.176 |
0.000 0.000 | 0.000 |
| 2 spectra, LQSLWASGR | 0.032 | 0.085 | 0.000 | 0.064 | 0.000 | 0.818 | 0.000 | 0.000 | ||
| 2 spectra, SMLLQR | 0.000 | 0.111 | 0.170 | 0.000 | 0.110 | 0.473 | 0.136 | 0.000 | ||
| 2 spectra, TIVNTDPVSR | 0.000 | 0.000 | 0.094 | 0.000 | 0.006 | 0.771 | 0.130 | 0.000 | ||
| 2 spectra, TGVEVPR | 0.000 | 0.153 | 0.013 | 0.105 | 0.000 | 0.582 | 0.147 | 0.000 | ||
| 2 spectra, LGPDPFK | 0.000 | 0.139 | 0.012 | 0.000 | 0.000 | 0.474 | 0.375 | 0.000 |
| Plot | Mito | Lyso or Perox | ER | Golgi | PM | Cytosol | Nucleus | ||||||
| Expt B |
1 peptide |
1 spectrum |
 |
0.000 NA | NA |
0.170 NA | NA |
0.000 NA | NA |
0.043 NA | NA |
0.572 NA | NA |
0.215 NA | NA |
0.000 NA | NA |
|||
| Plot | Lyso | Other | |||||||||||
| Expt C |
6 peptides |
11 spectra |
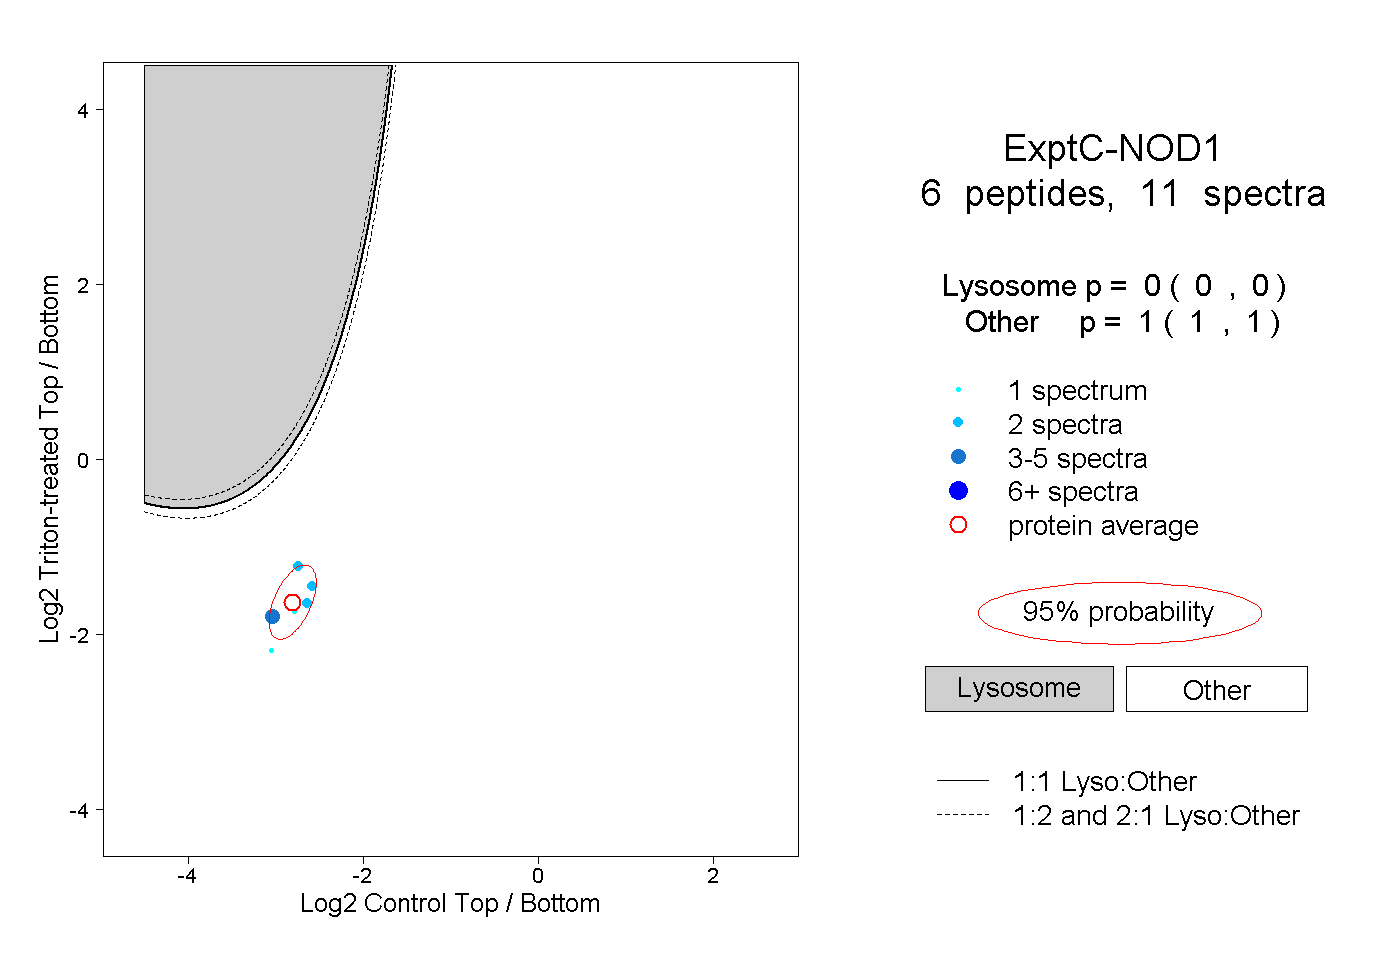 |
0.000 0.000 | 0.000 |
1.000 1.000 | 1.000 |
||||||||
| Plot | Lyso | Other | |||||||||||
| Expt D |
1 peptide |
1 spectrum |
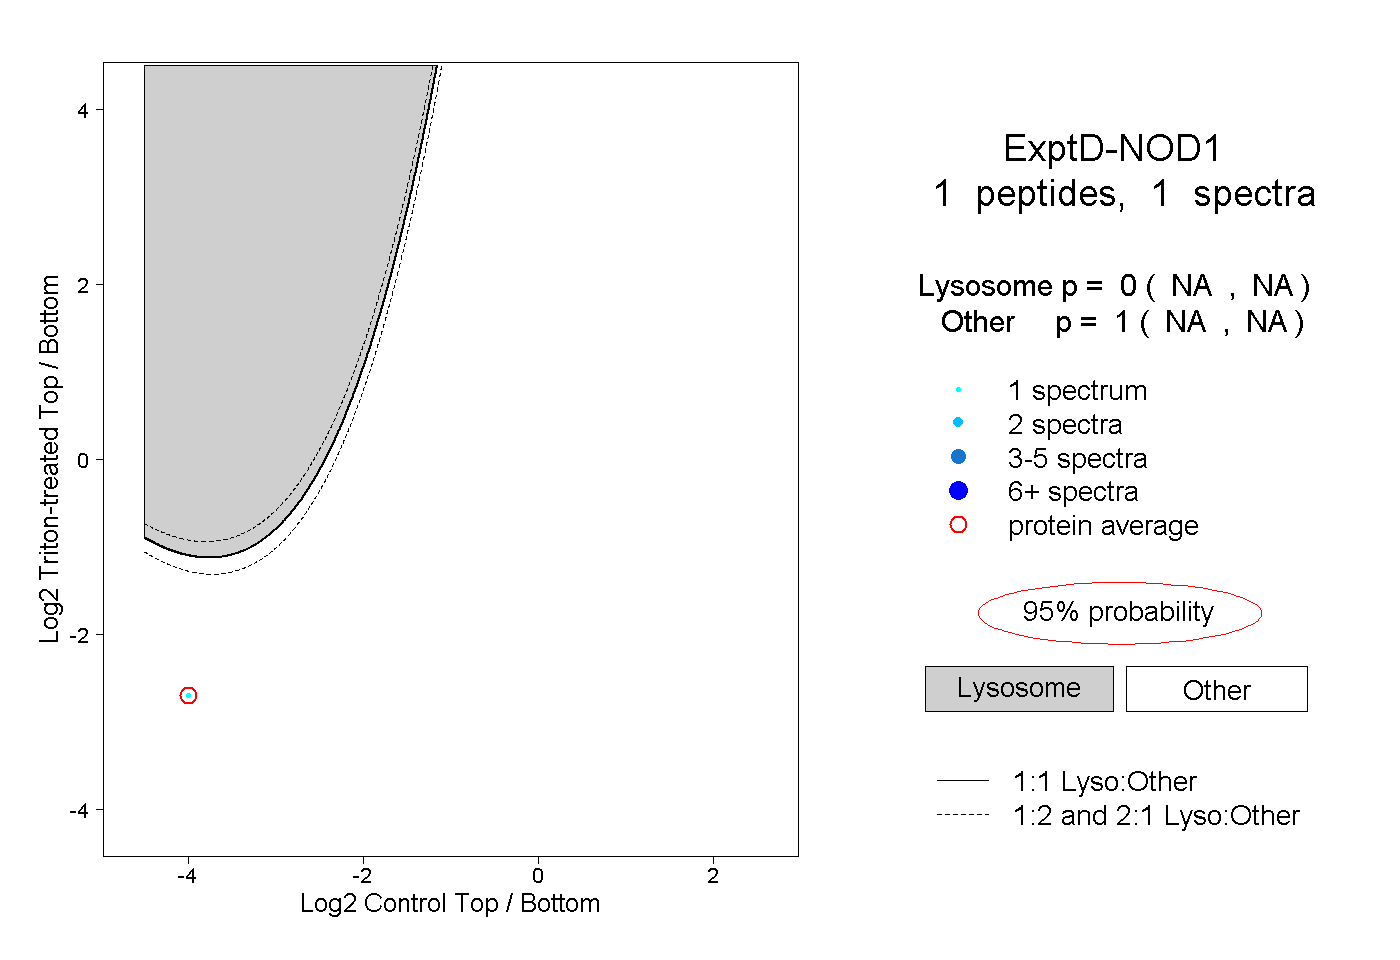 |
0.000 NA | NA |
1.000 NA | NA |