 5
5peptides
spectra
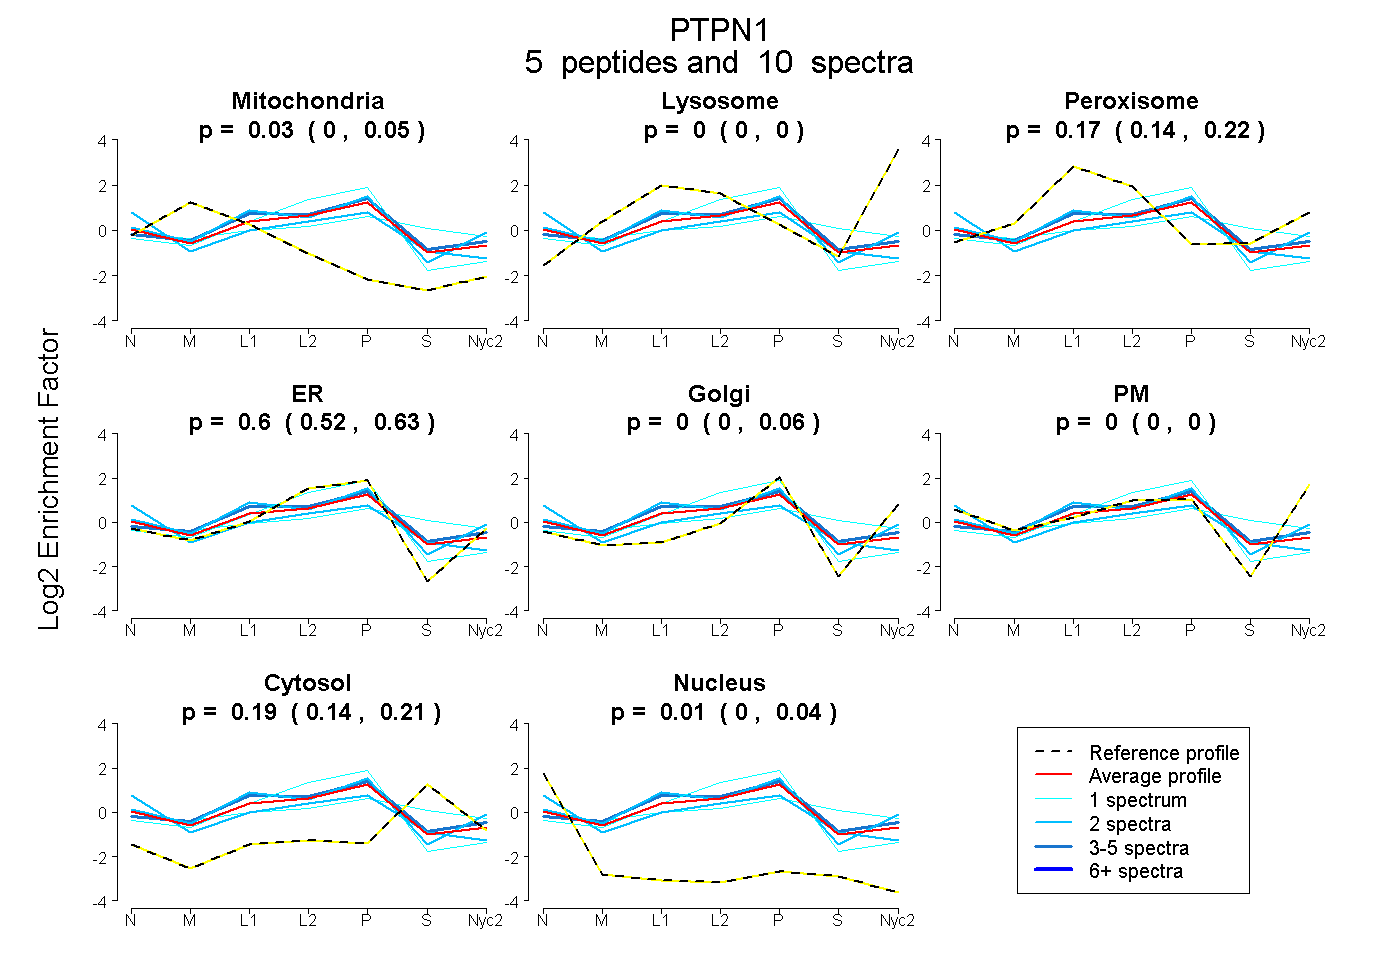
0.000 | 0.049
0.000 | 0.000
0.136 | 0.220
0.518 | 0.627
0.000 | 0.062
0.000 | 0.000
0.144 | 0.212
0.000 | 0.041
1peptide
spectrum
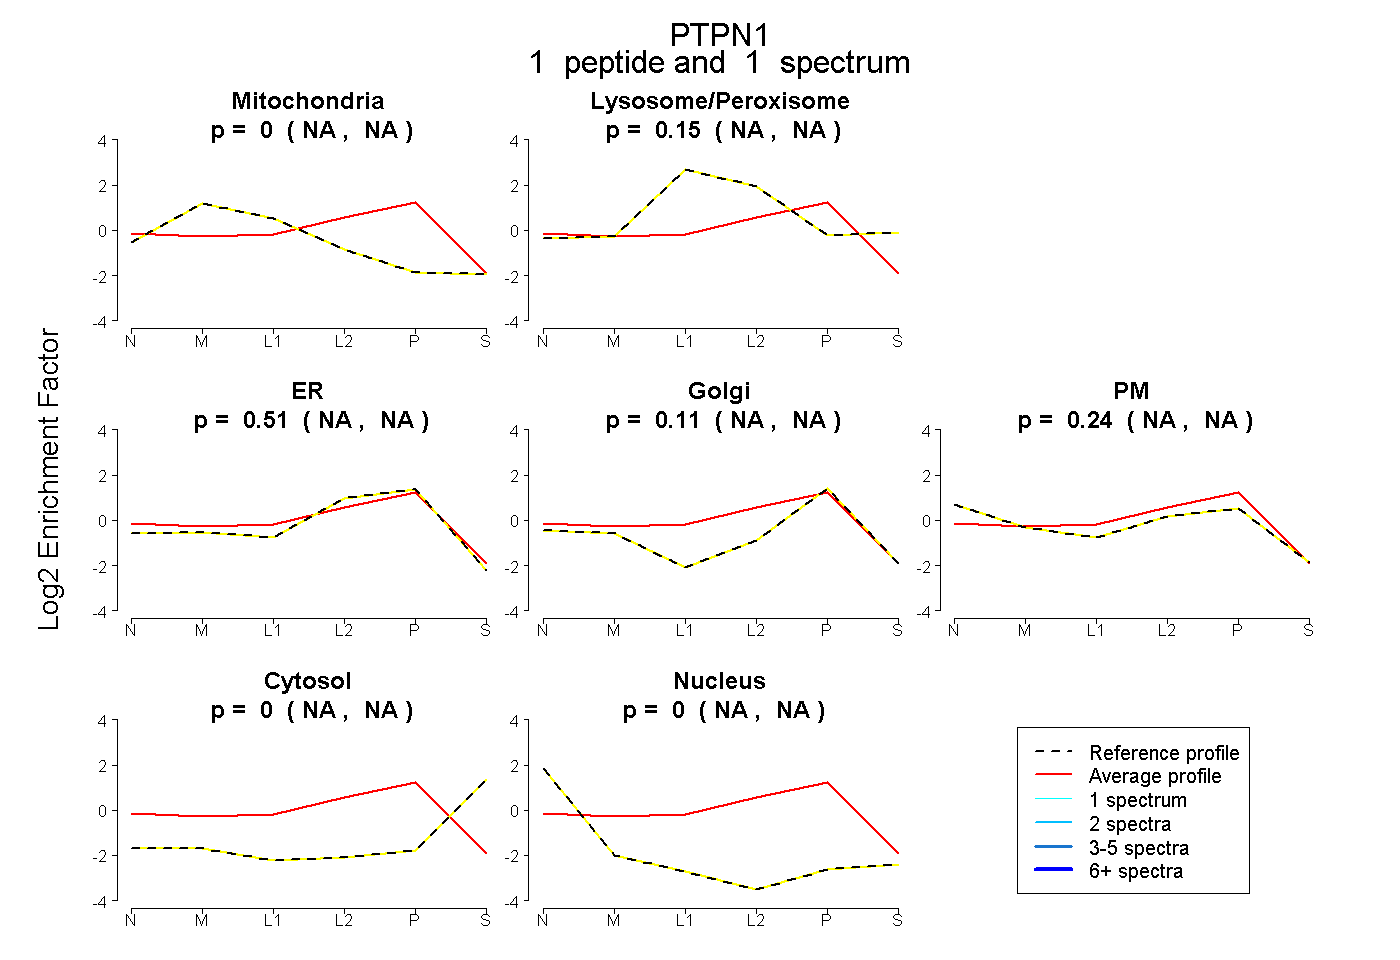
NA | NA
NA | NA
NA | NA
NA | NA
NA | NA
NA | NA
NA | NA
10peptides
spectra
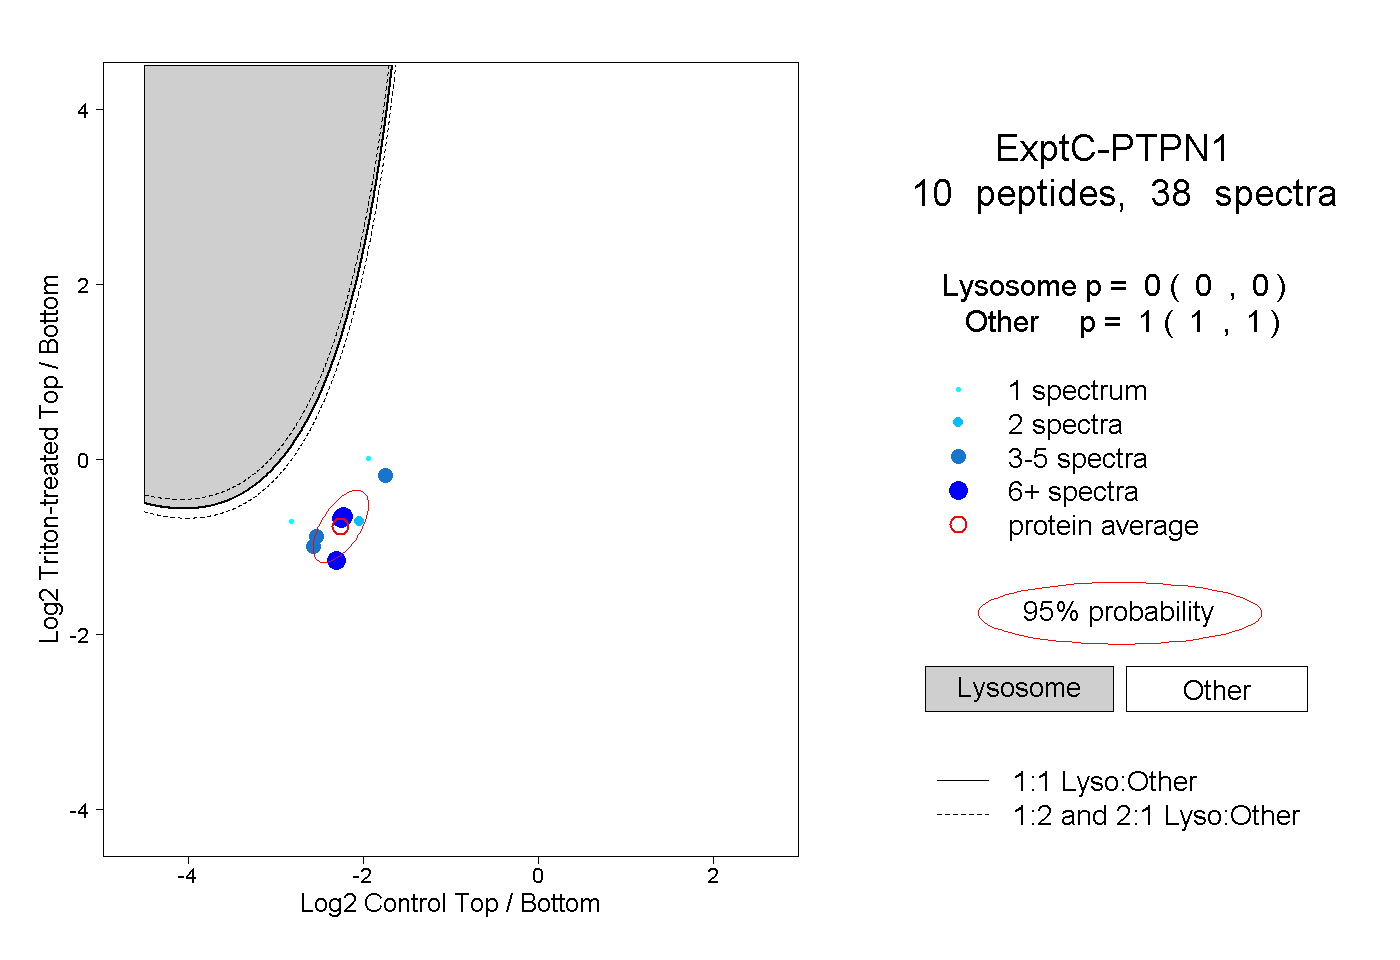
0.000 | 0.000
1.000 | 1.000
3peptides
spectra
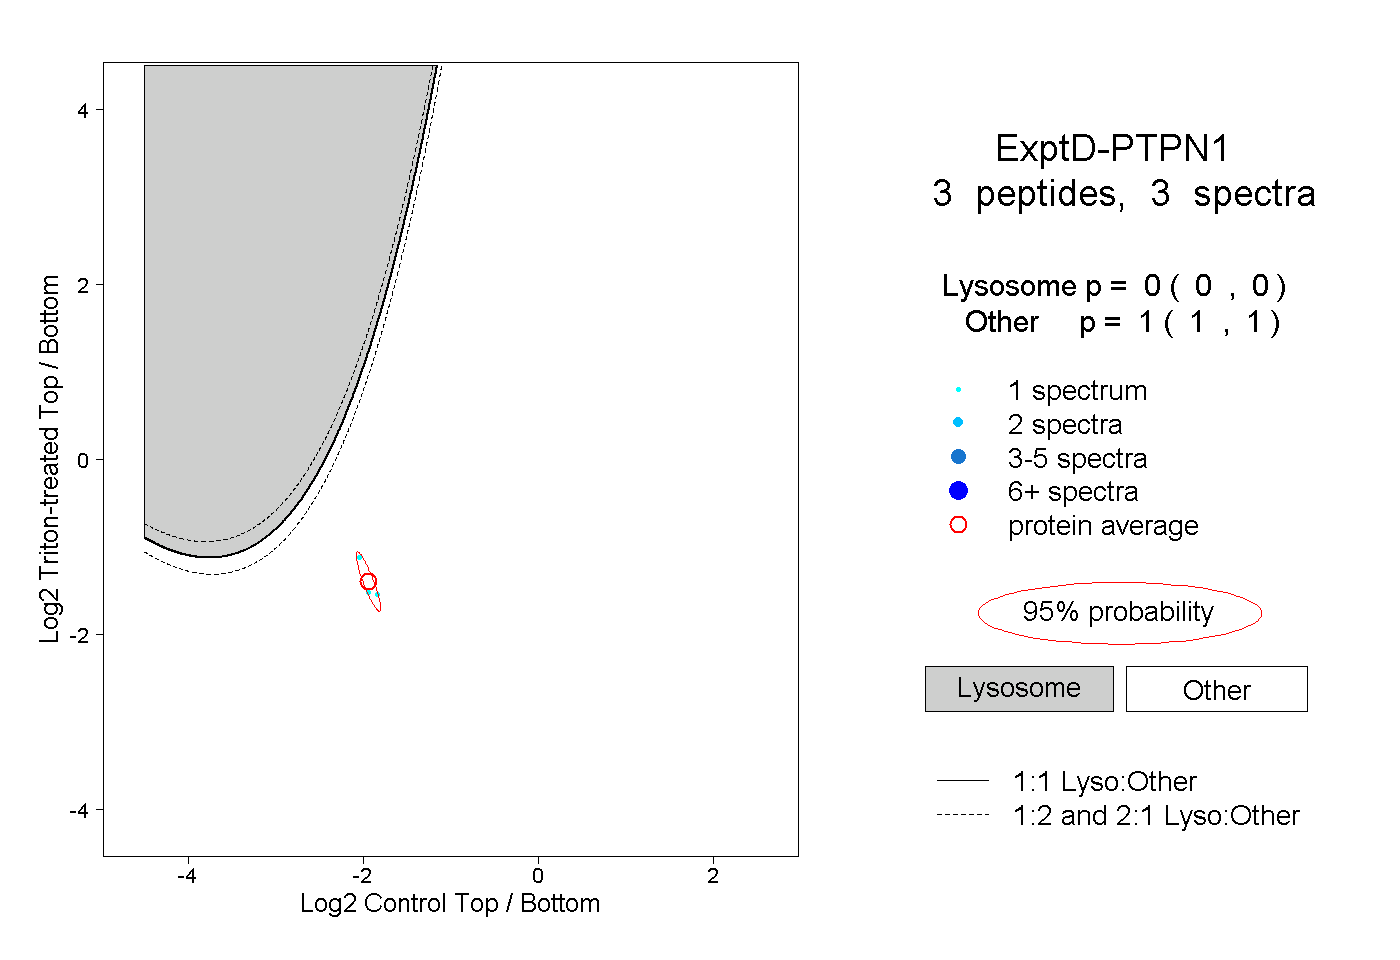
0.000 | 0.000
1.000 | 1.000