 6
6peptides
spectra
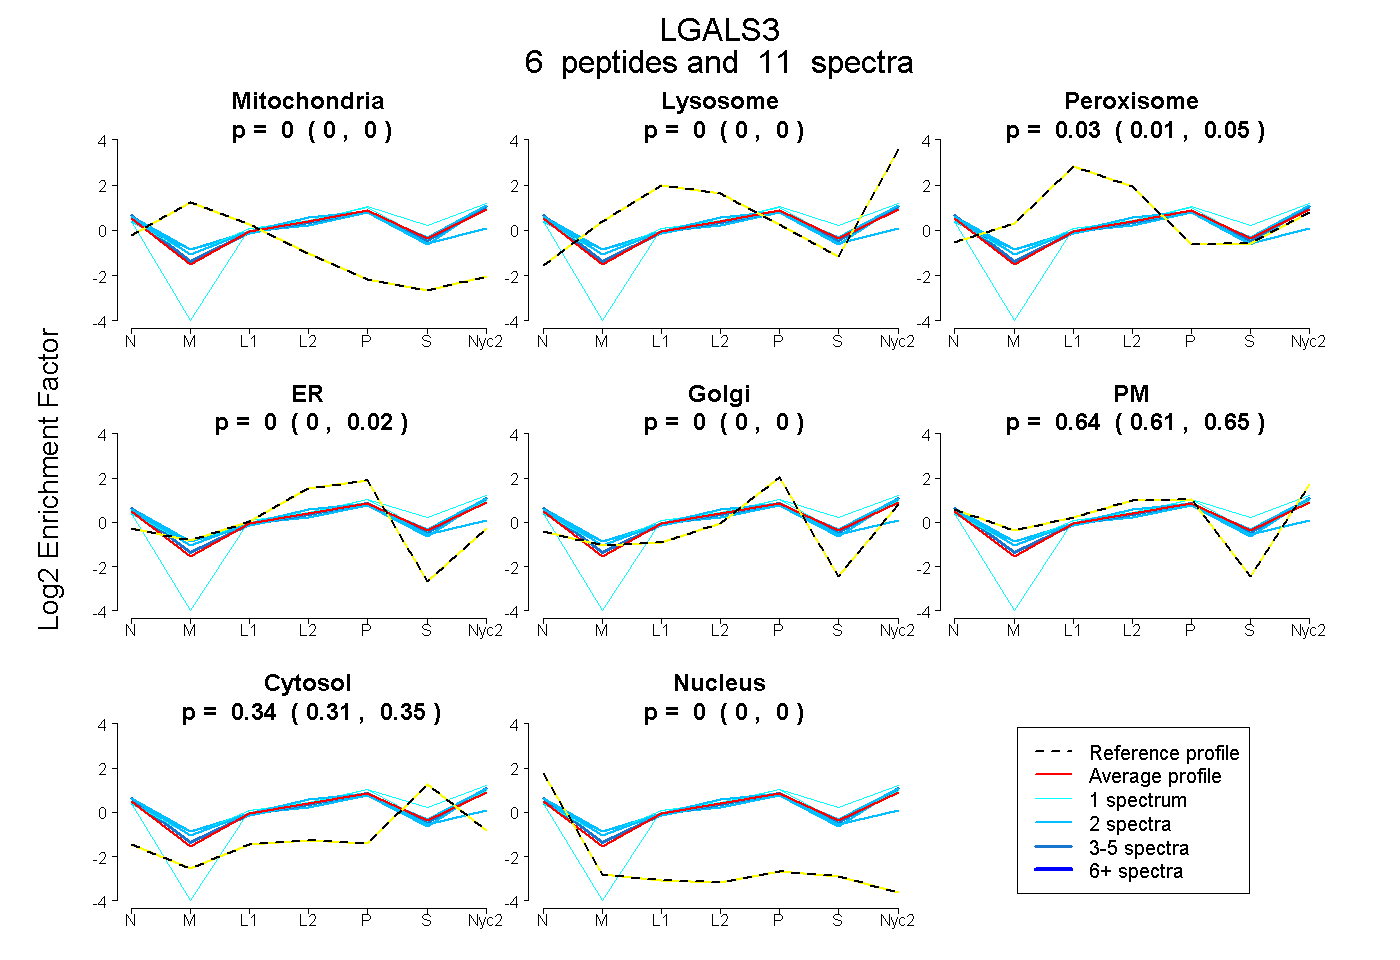
0.000 | 0.000
0.000 | 0.000
0.006 | 0.046
0.000 | 0.019
0.000 | 0.000
0.610 | 0.649
0.314 | 0.351
0.000 | 0.000
2peptides
spectra
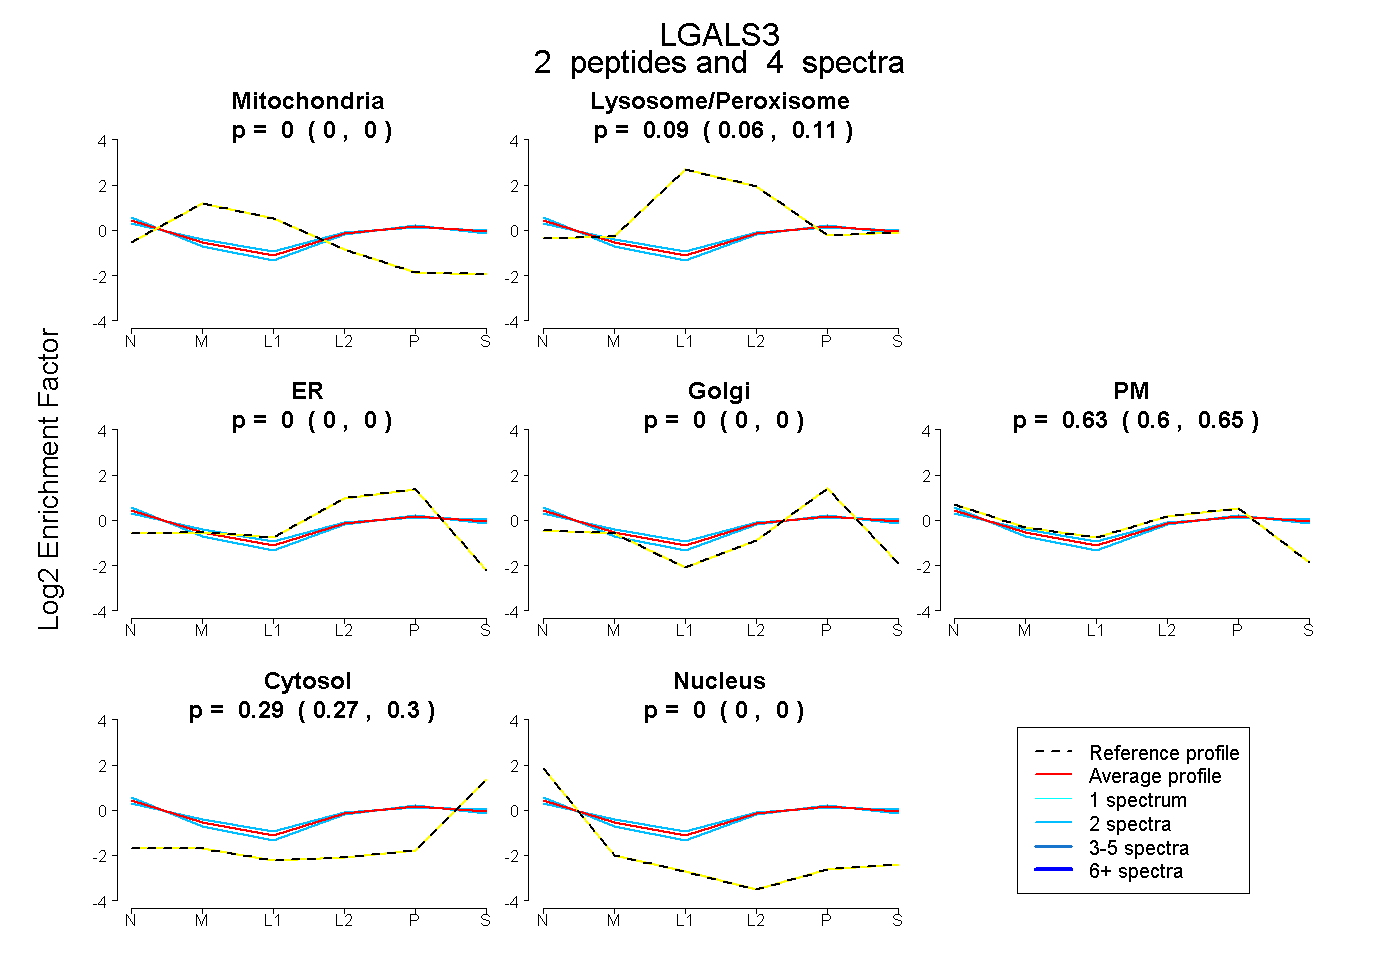
0.000 | 0.000
0.056 | 0.112
0.000 | 0.000
0.000 | 0.000
0.599 | 0.648
0.273 | 0.300
0.000 | 0.000
6peptides
spectra
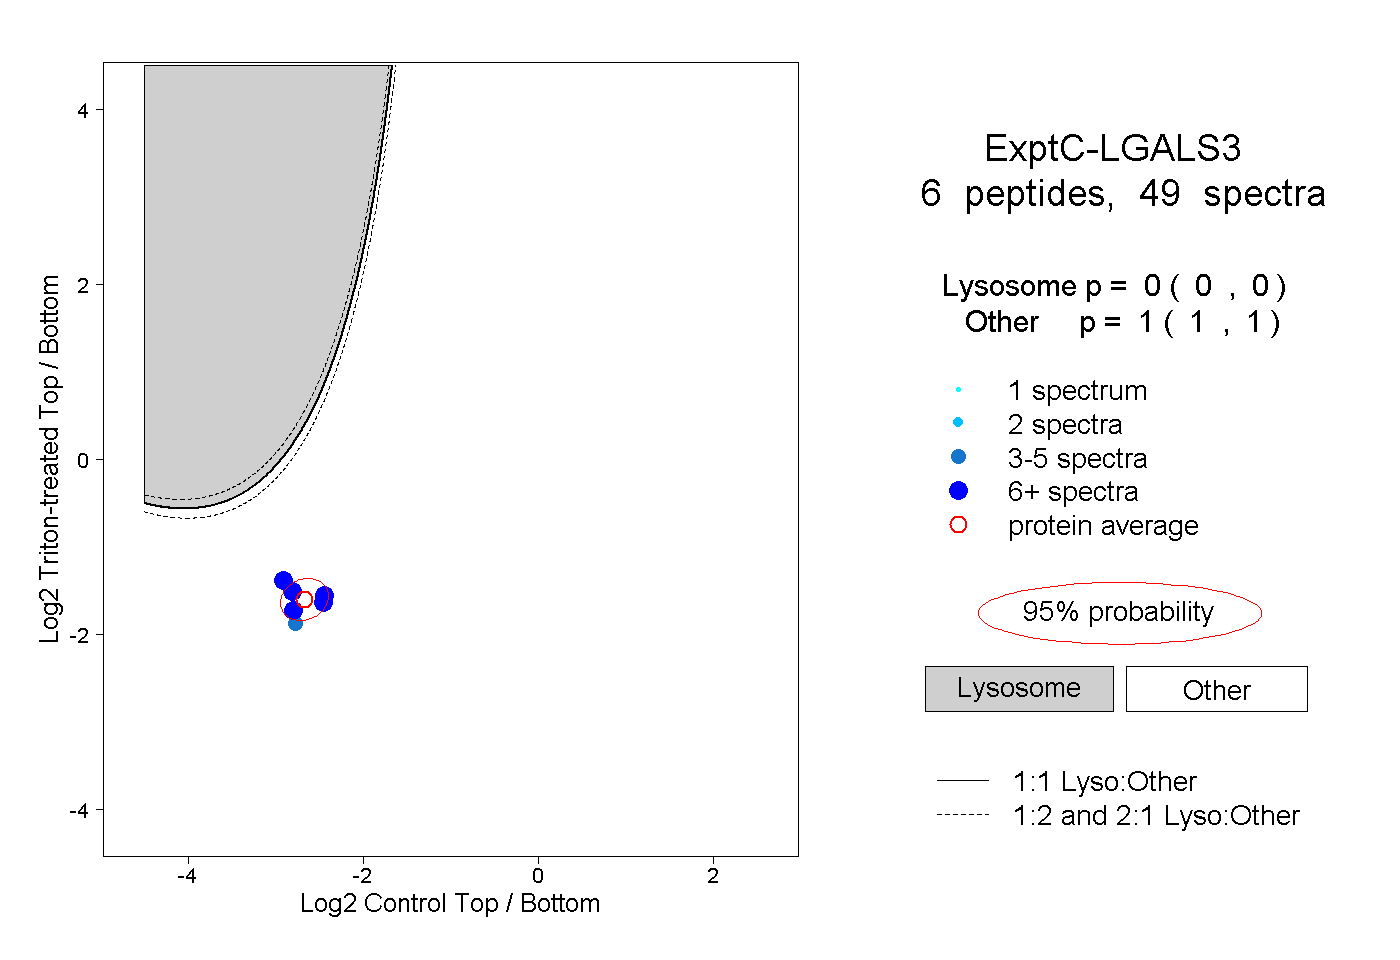
0.000 | 0.000
1.000 | 1.000
2peptides
spectra
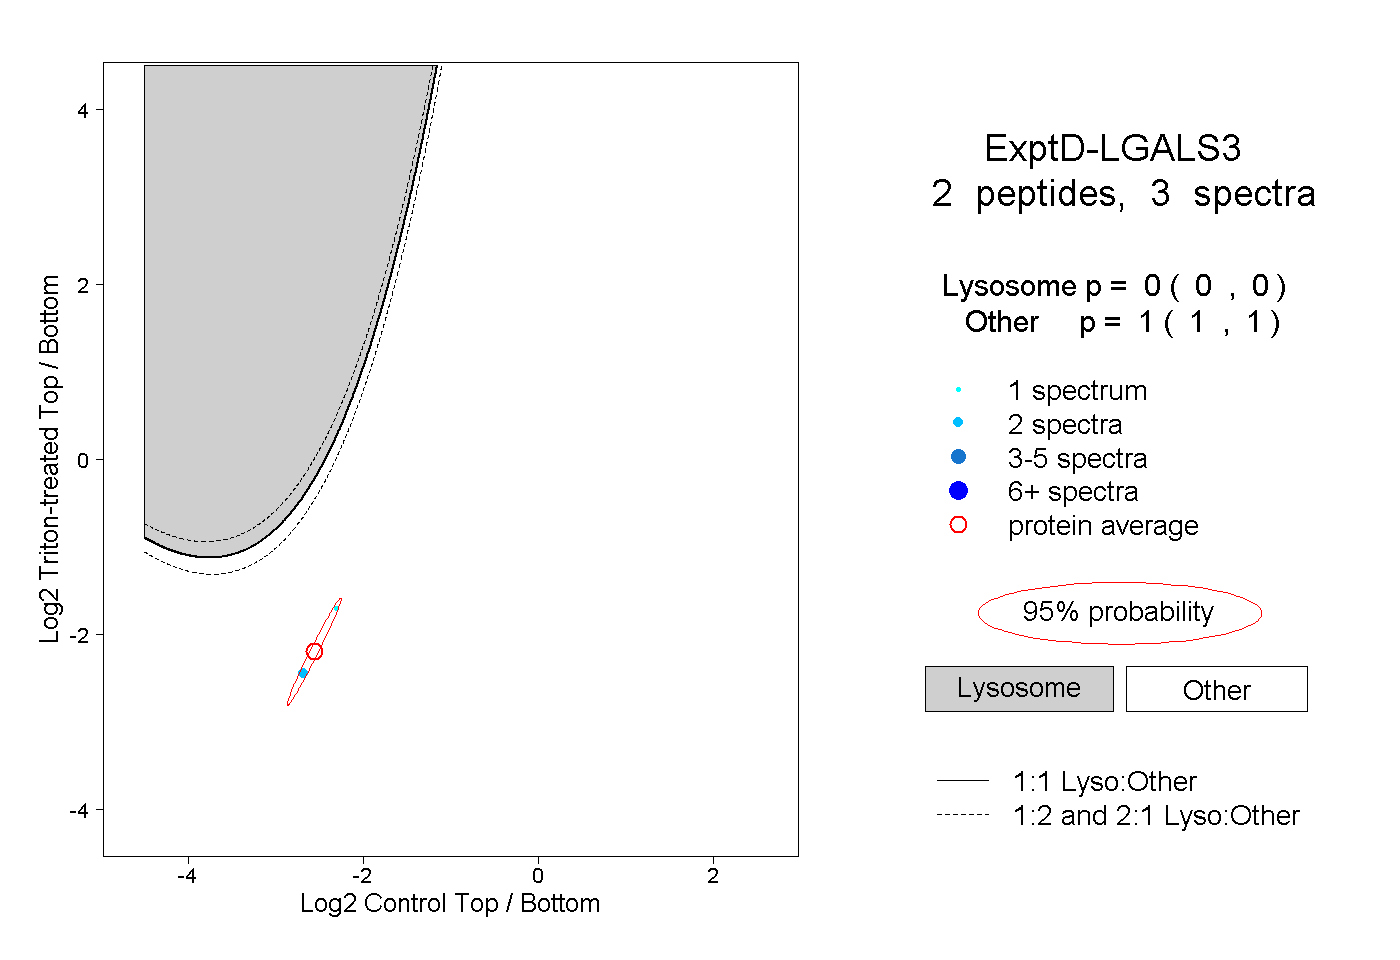
0.000 | 0.000
1.000 | 1.000