 6
6peptides
spectra
0.000 | 0.000
0.000 | 0.000
0.006 | 0.046
0.000 | 0.019
0.000 | 0.000
0.610 | 0.649
0.314 | 0.351
0.000 | 0.000
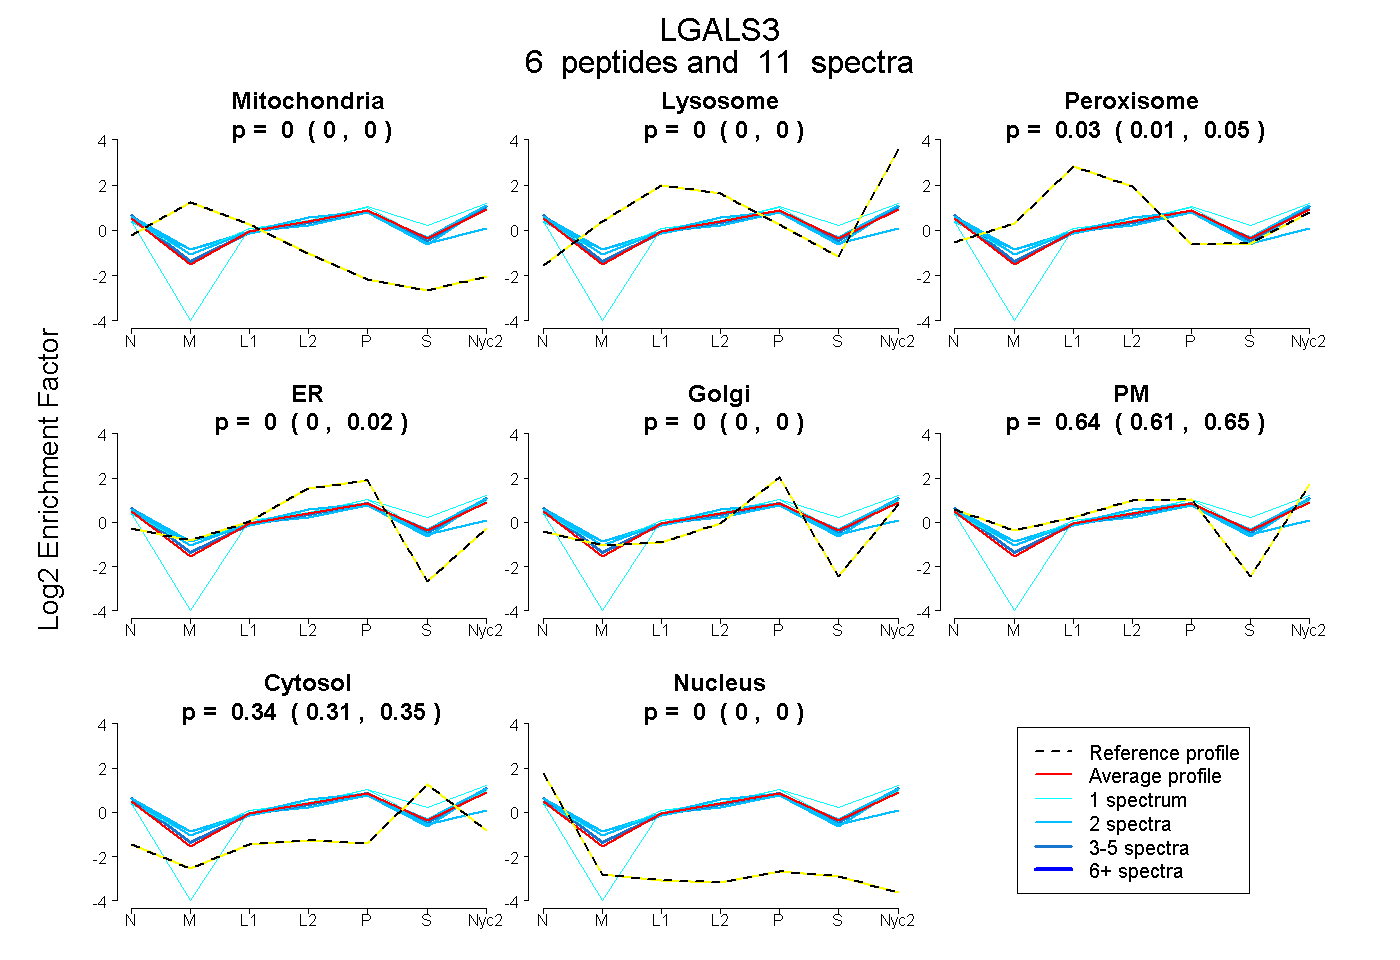
| Plot | Mito | Lyso | Perox | ER | Golgi | PM | Cytosol | Nucleus | |||||
| Expt A |
6 peptides |
11 spectra |
|
0.000 0.000 | 0.000 |
0.000 0.000 | 0.000 |
0.027 0.006 | 0.046 |
0.000 0.000 | 0.019 |
0.000 0.000 | 0.000 |
0.637 0.610 | 0.649 |
0.336 0.314 | 0.351 |
0.000 0.000 | 0.000 |
| 1 spectrum, VAVNDVHLLQYNHR | 0.000 | 0.000 | 0.000 | 0.000 | 0.038 | 0.478 | 0.484 | 0.000 | ||
| 2 spectra, VIVCNTK | 0.000 | 0.000 | 0.083 | 0.255 | 0.000 | 0.361 | 0.295 | 0.007 | ||
| 2 spectra, QDNNWGR | 0.000 | 0.019 | 0.053 | 0.000 | 0.000 | 0.625 | 0.304 | 0.000 | ||
| 3 spectra, IQVLVEADHFK | 0.000 | 0.000 | 0.009 | 0.000 | 0.000 | 0.680 | 0.311 | 0.000 | ||
| 2 spectra, GNDIAFHFNPR | 0.000 | 0.000 | 0.028 | 0.000 | 0.000 | 0.695 | 0.277 | 0.000 | ||
| 1 spectrum, QSAFPFESGKPFK | 0.000 | 0.000 | 0.098 | 0.000 | 0.070 | 0.564 | 0.269 | 0.000 |
| Plot | Mito | Lyso or Perox | ER | Golgi | PM | Cytosol | Nucleus | ||||||
| Expt B |
2 peptides |
4 spectra |
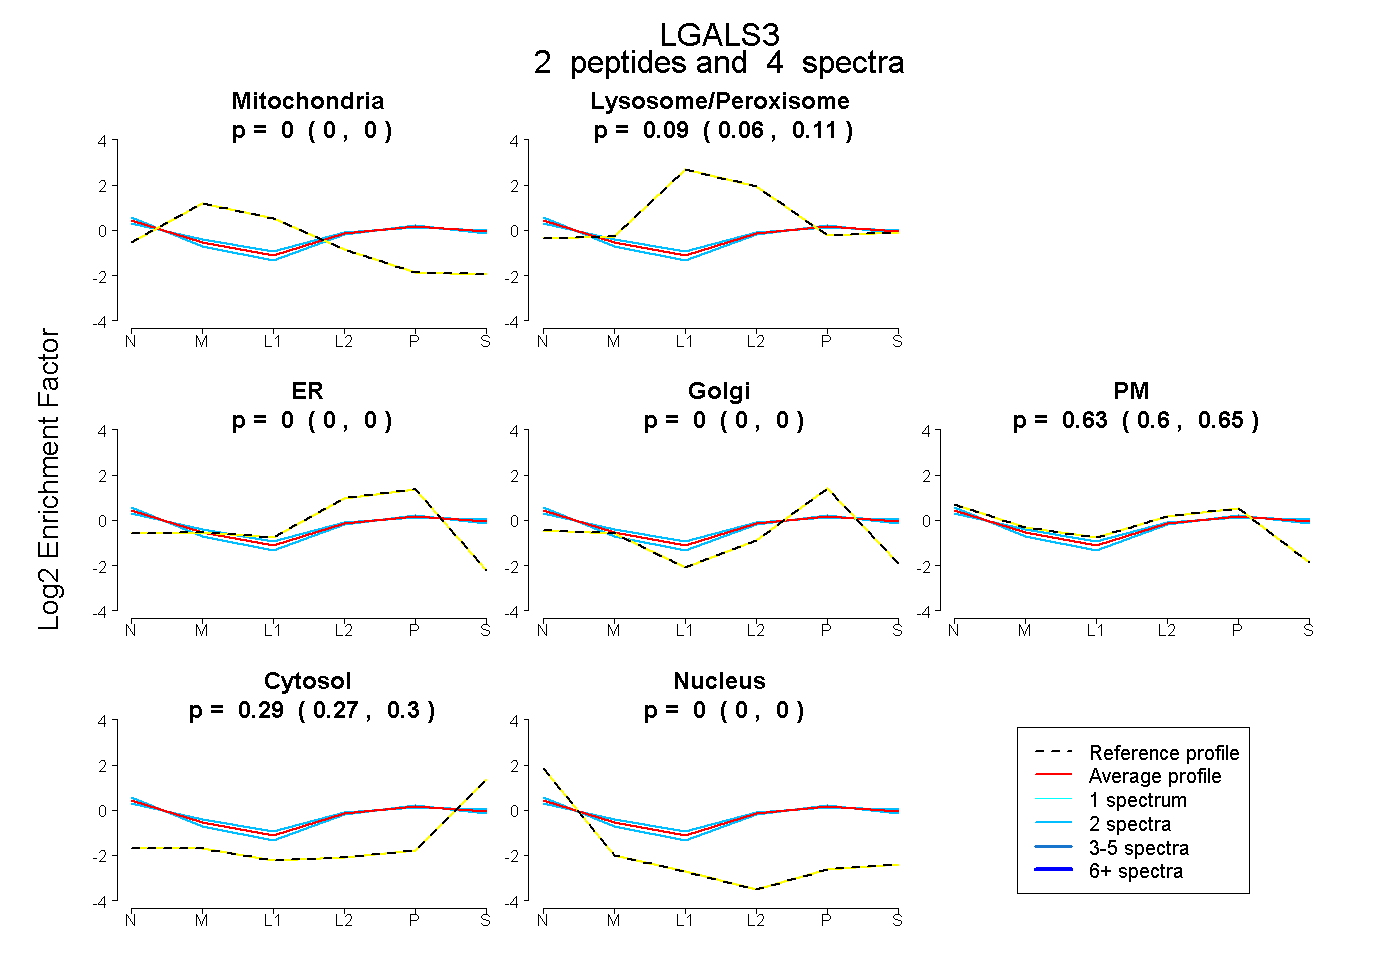 |
0.000 0.000 | 0.000 |
0.087 0.056 | 0.112 |
0.000 0.000 | 0.000 |
0.000 0.000 | 0.000 |
0.626 0.599 | 0.648 |
0.287 0.273 | 0.300 |
0.000 0.000 | 0.000 |
|||
| Plot | Lyso | Other | |||||||||||
| Expt C |
6 peptides |
49 spectra |
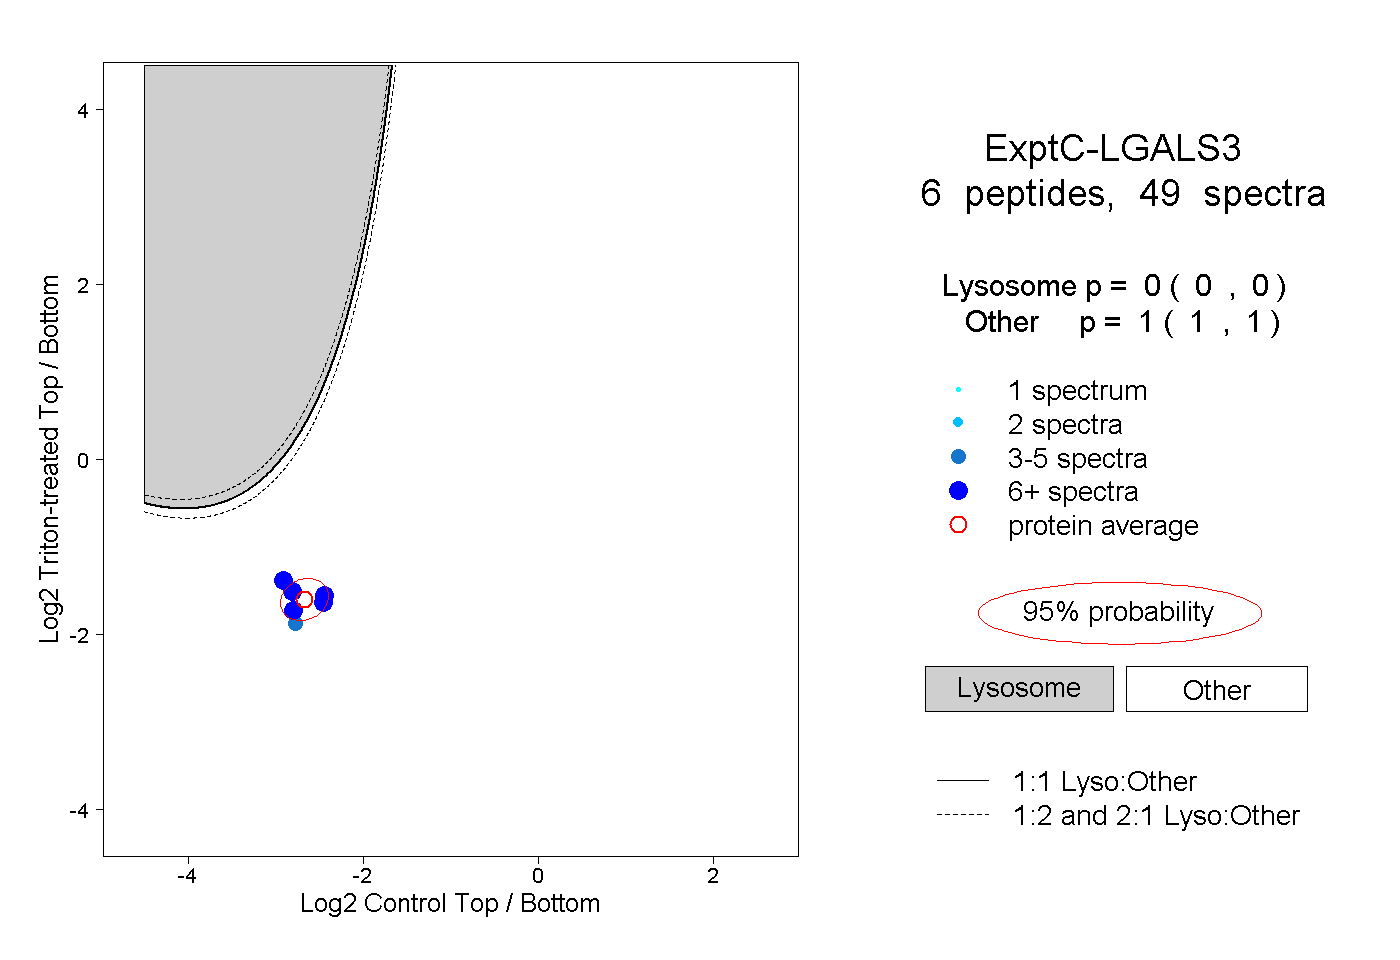 |
0.000 0.000 | 0.000 |
1.000 1.000 | 1.000 |
||||||||
| Plot | Lyso | Other | |||||||||||
| Expt D |
2 peptides |
3 spectra |
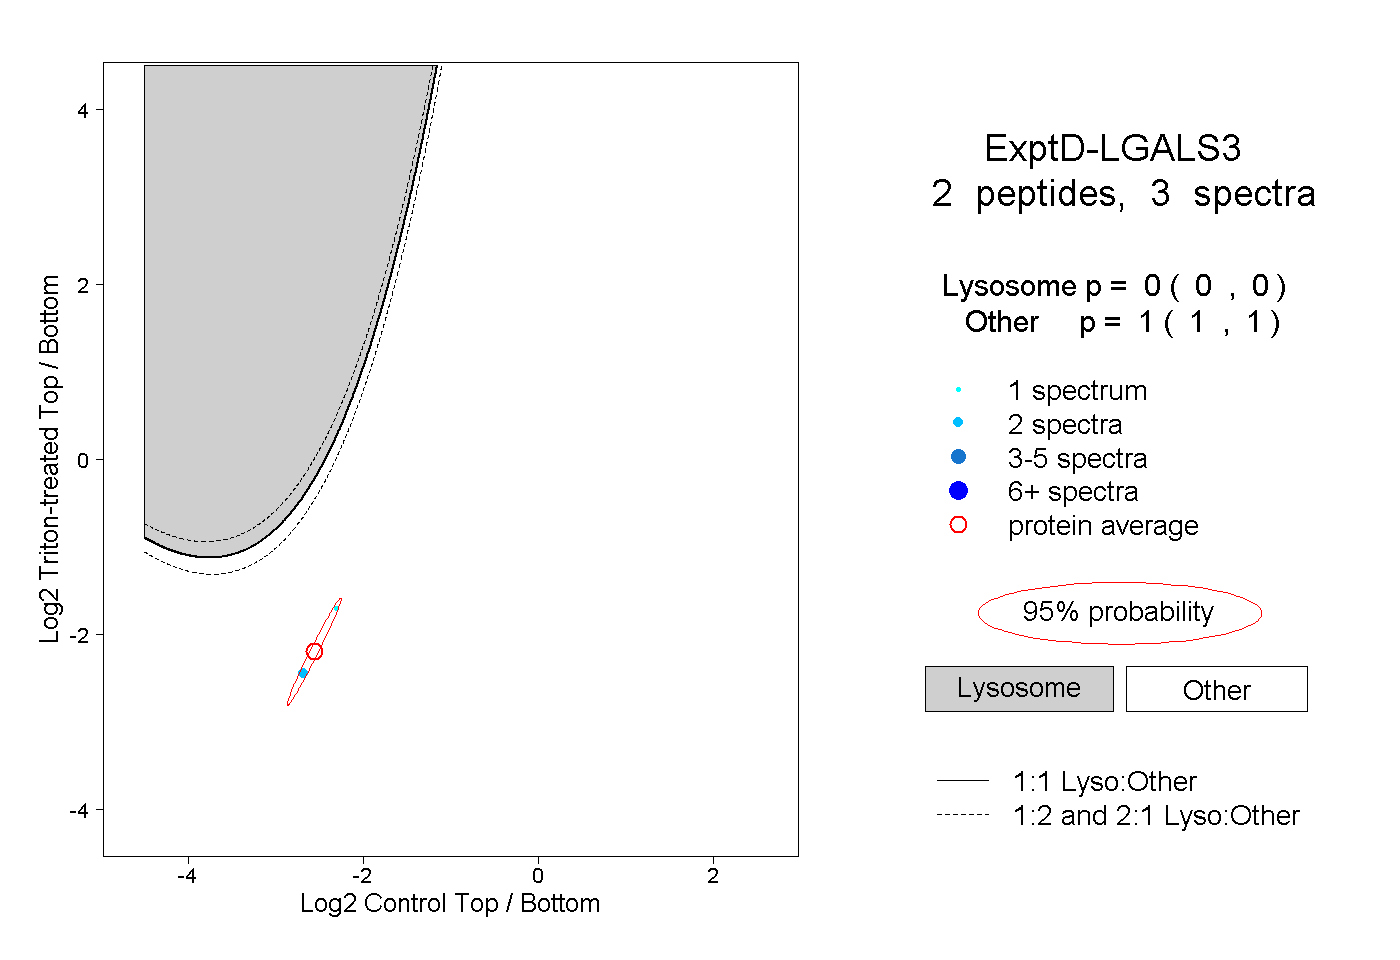 |
0.000 0.000 | 0.000 |
1.000 1.000 | 1.000 |