 6
6peptides
spectra
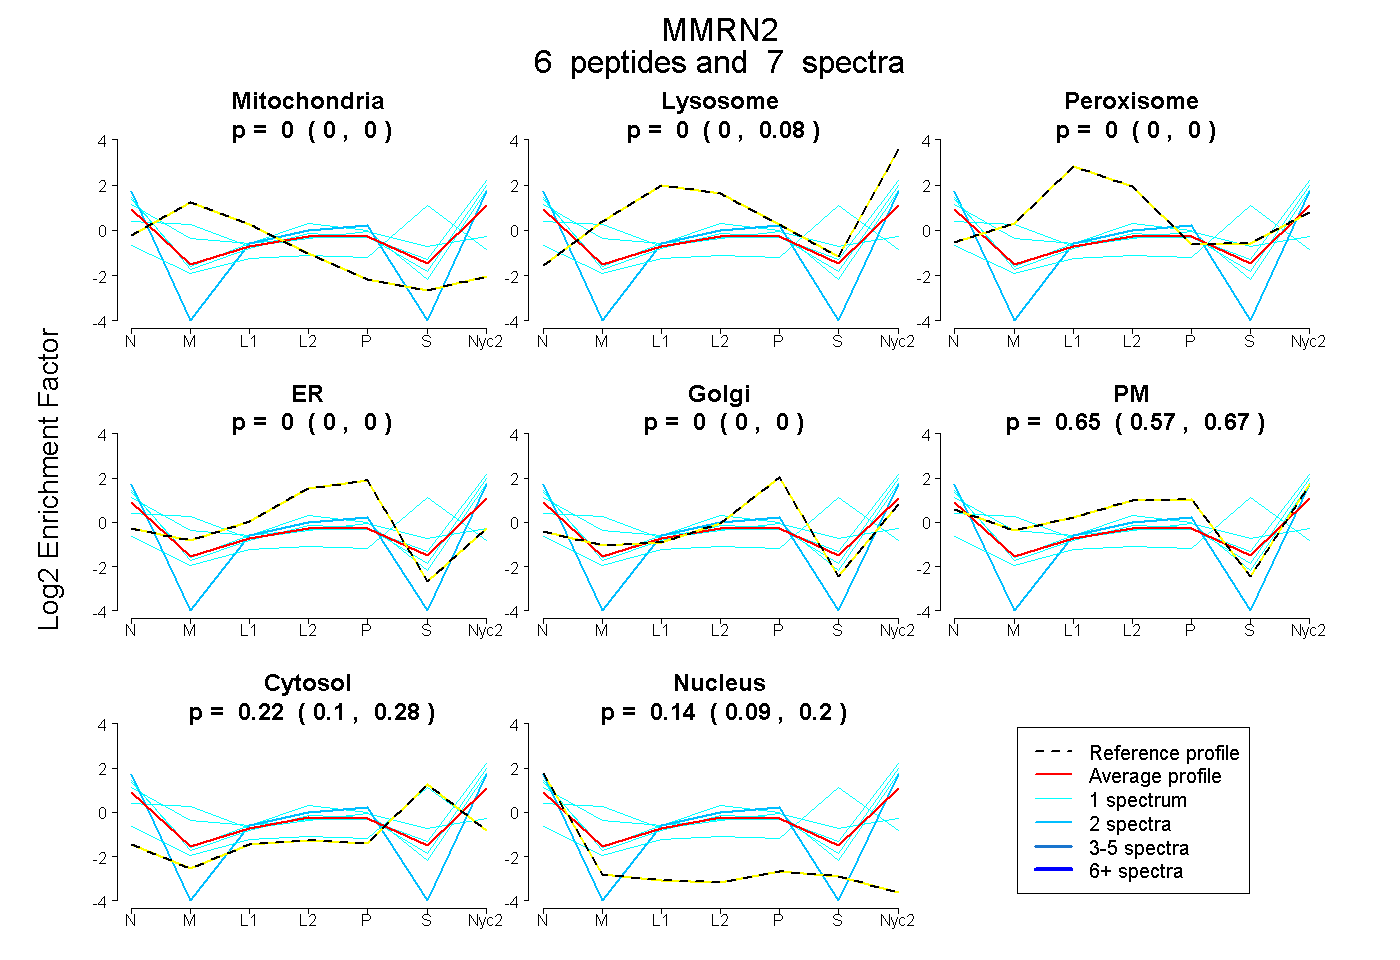
0.000 | 0.000
0.000 | 0.076
0.000 | 0.000
0.000 | 0.000
0.000 | 0.000
0.574 | 0.675
0.105 | 0.284
0.089 | 0.199
1peptide
spectrum
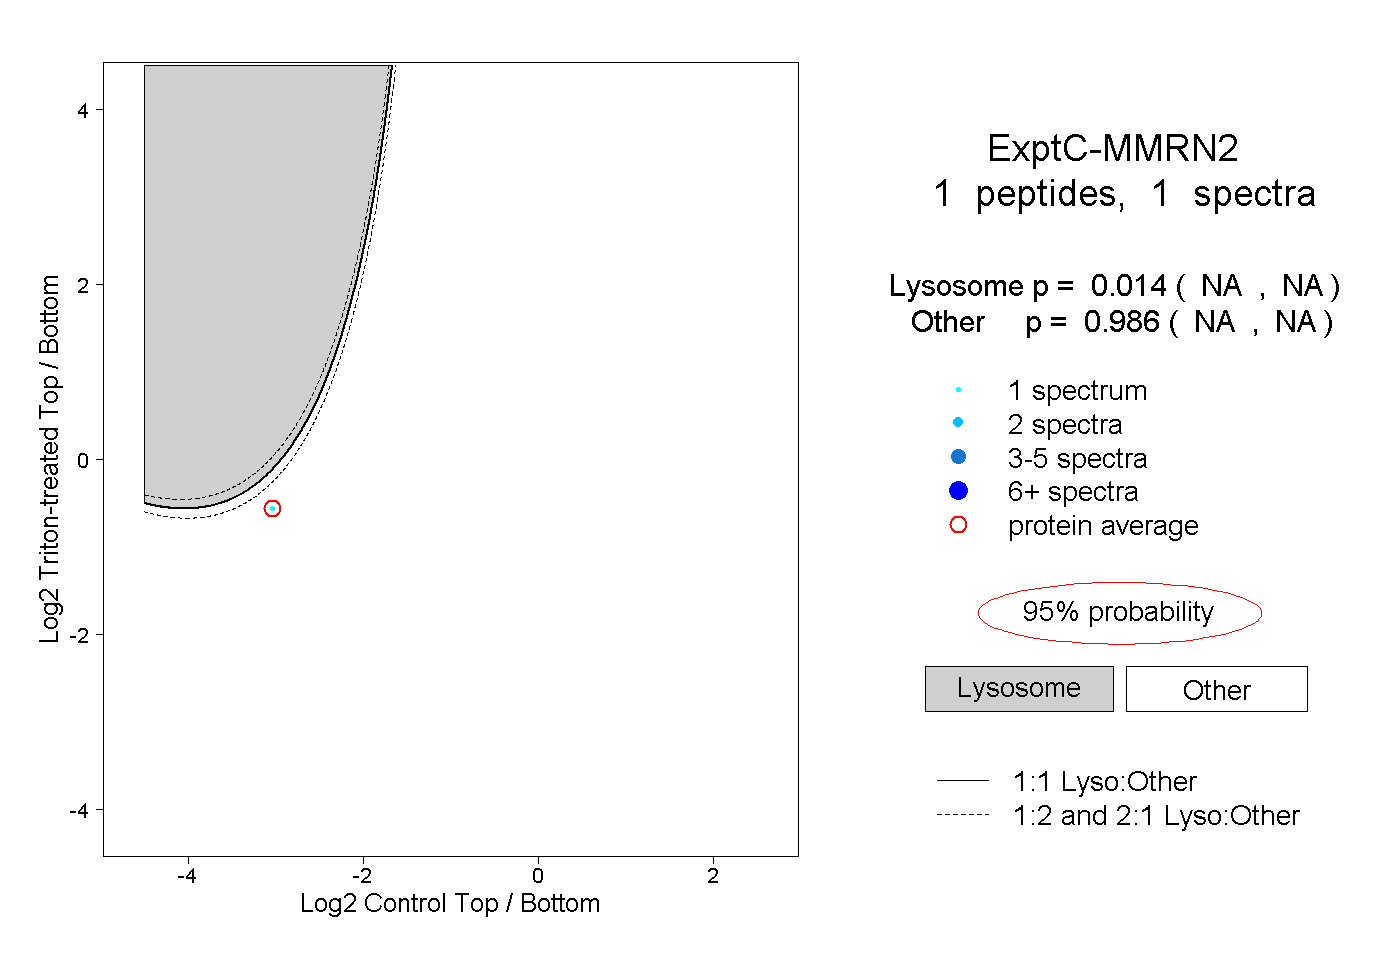
NA | NA
NA | NA
| Plot | Mito | Lyso | Perox | ER | Golgi | PM | Cytosol | Nucleus | |||||
| Expt A |
6 peptides |
7 spectra |
|
0.000 0.000 | 0.000 |
0.000 0.000 | 0.076 |
0.000 0.000 | 0.000 |
0.000 0.000 | 0.000 |
0.000 0.000 | 0.000 |
0.646 0.574 | 0.675 |
0.216 0.105 | 0.284 |
0.138 0.089 | 0.199 |
||
| Plot | Lyso | Other | |||||||||||
| Expt C |
1 peptide |
1 spectrum |
|
0.014 NA | NA |
0.986 NA | NA |