 6
6peptides
spectra
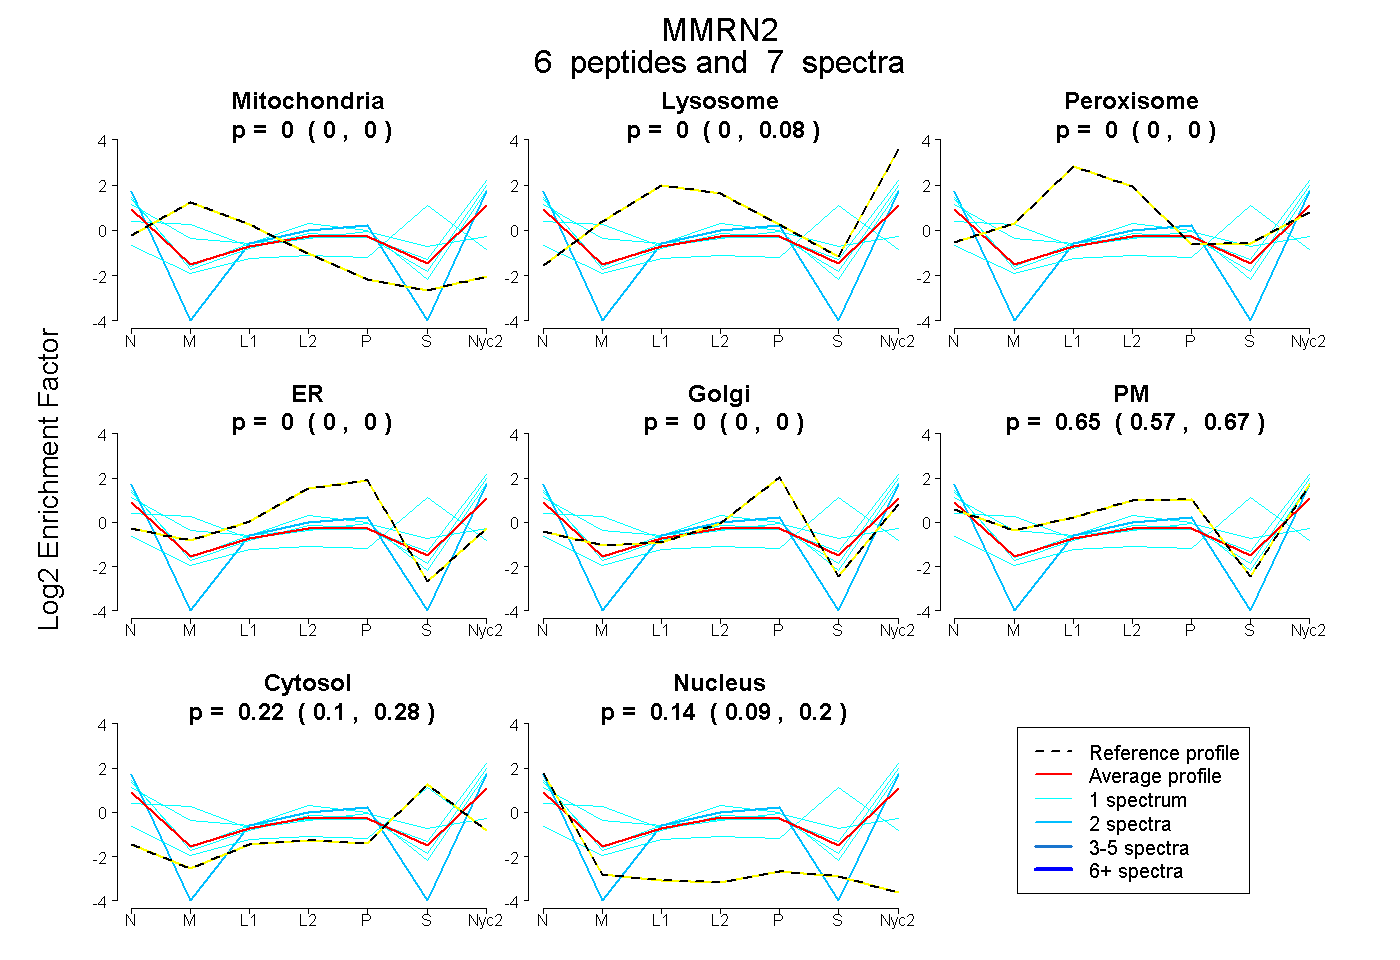
0.000 | 0.000
0.000 | 0.076
0.000 | 0.000
0.000 | 0.000
0.000 | 0.000
0.574 | 0.675
0.105 | 0.284
0.089 | 0.199
| Plot | Mito | Lyso | Perox | ER | Golgi | PM | Cytosol | Nucleus | |||||
| Expt A |
6 peptides |
7 spectra |
|
0.000 0.000 | 0.000 |
0.000 0.000 | 0.076 |
0.000 0.000 | 0.000 |
0.000 0.000 | 0.000 |
0.000 0.000 | 0.000 |
0.646 0.574 | 0.675 |
0.216 0.105 | 0.284 |
0.138 0.089 | 0.199 |
| 1 spectrum, VQQNSQR | 0.000 | 0.000 | 0.000 | 0.000 | 0.000 | 0.748 | 0.106 | 0.146 | ||
| 1 spectrum, VIIMEK | 0.007 | 0.000 | 0.073 | 0.000 | 0.000 | 0.039 | 0.828 | 0.054 | ||
| 1 spectrum, ALGDLEQEIQR | 0.000 | 0.022 | 0.000 | 0.000 | 0.000 | 0.696 | 0.196 | 0.086 | ||
| 1 spectrum, ALDHAVEALK | 0.000 | 0.082 | 0.000 | 0.000 | 0.000 | 0.776 | 0.000 | 0.142 | ||
| 1 spectrum, AAGGFVEQHPR | 0.284 | 0.000 | 0.000 | 0.000 | 0.045 | 0.391 | 0.279 | 0.000 | ||
| 2 spectra, FLVHSQQPCPQGAPDCQR | 0.000 | 0.000 | 0.000 | 0.000 | 0.000 | 0.736 | 0.000 | 0.264 |
| Plot | Lyso | Other | |||||||||||
| Expt C |
1 peptide |
1 spectrum |
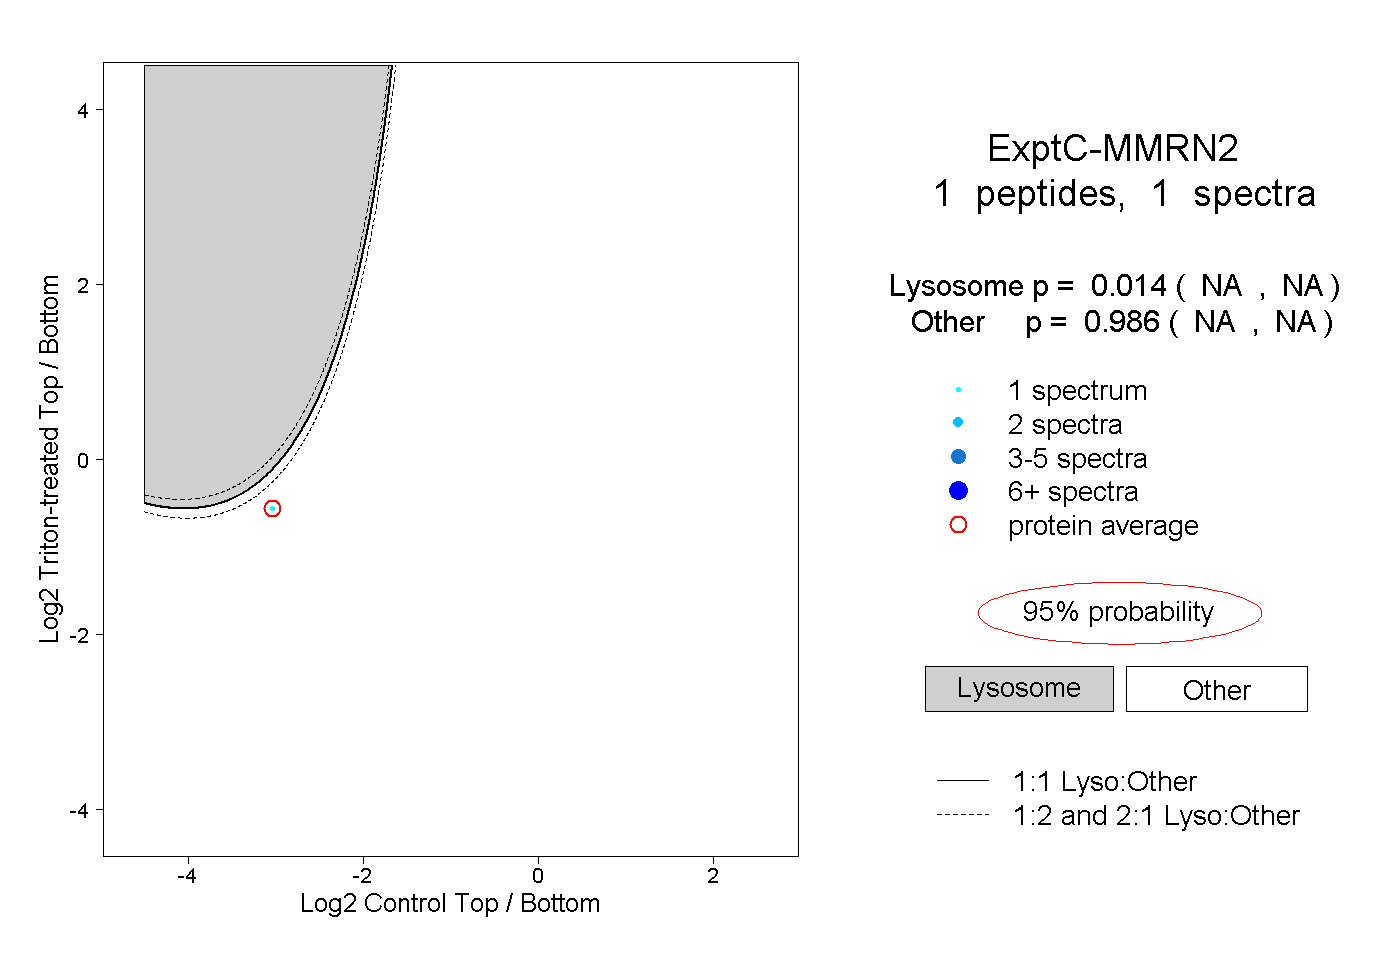 |
0.014 NA | NA |
0.986 NA | NA |