 23
23peptides
spectra
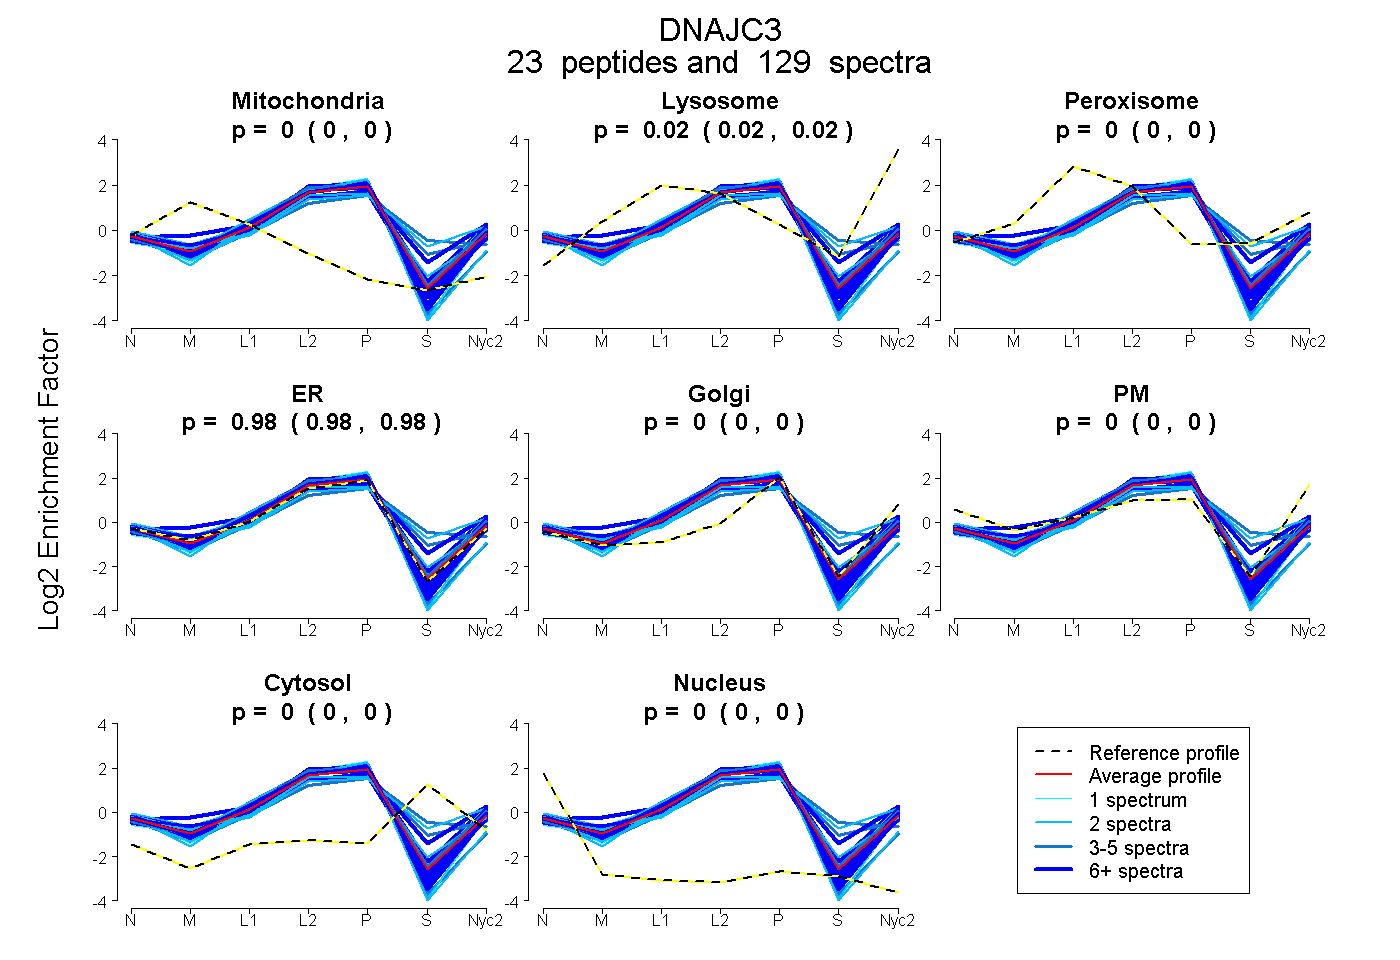
0.000 | 0.000
0.017 | 0.022
0.000 | 0.000
0.976 | 0.982
0.000 | 0.000
0.000 | 0.000
0.000 | 0.002
0.000 | 0.000
18peptides
spectra
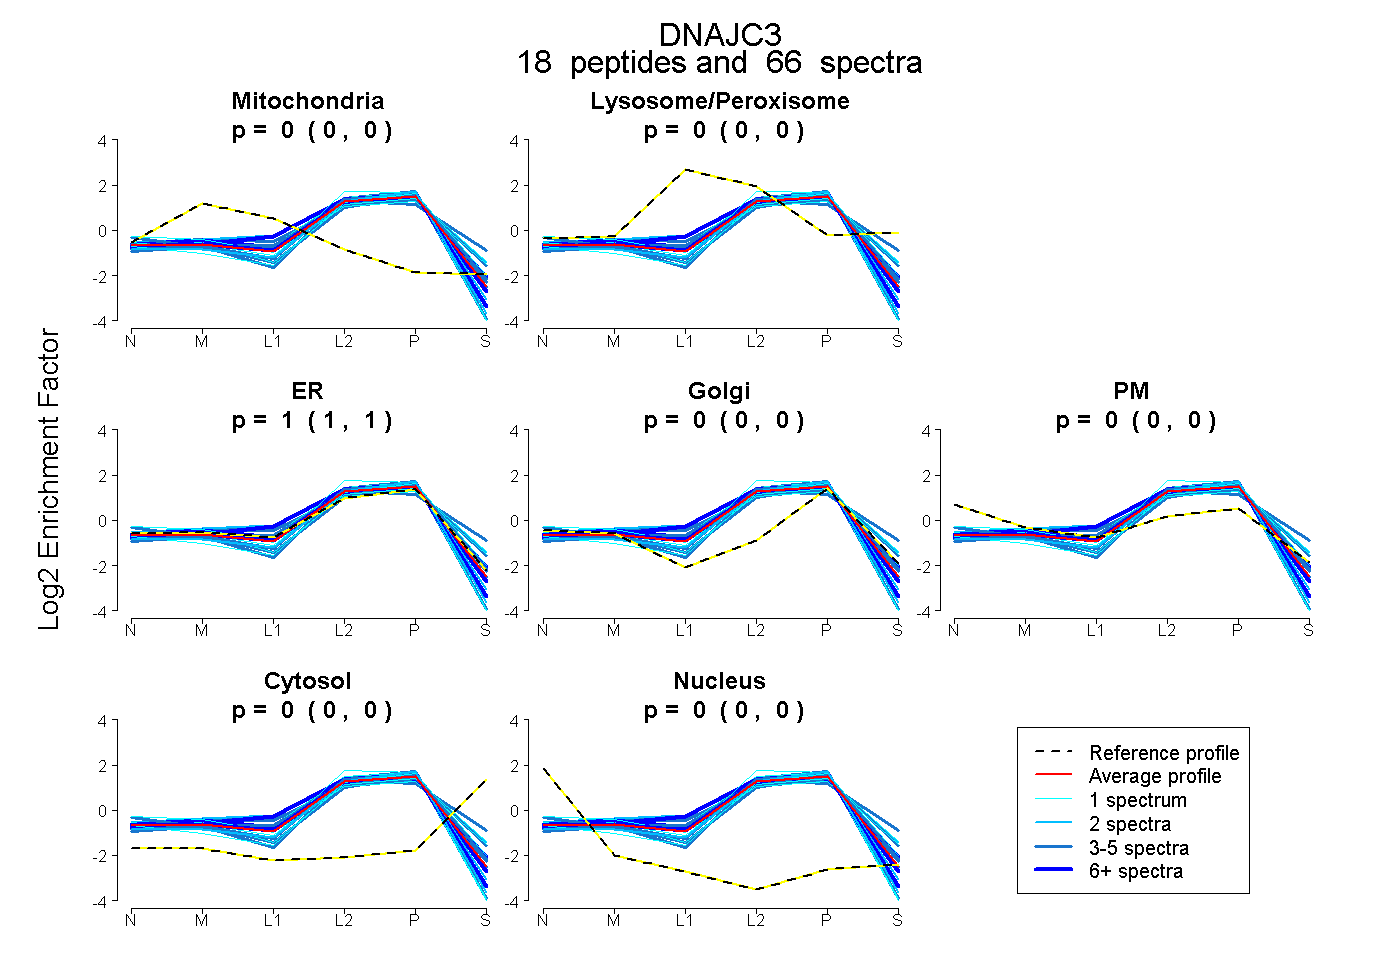
0.000 | 0.000
0.000 | 0.000
1.000 | 1.000
0.000 | 0.000
0.000 | 0.000
0.000 | 0.000
0.000 | 0.000
23peptides
spectra
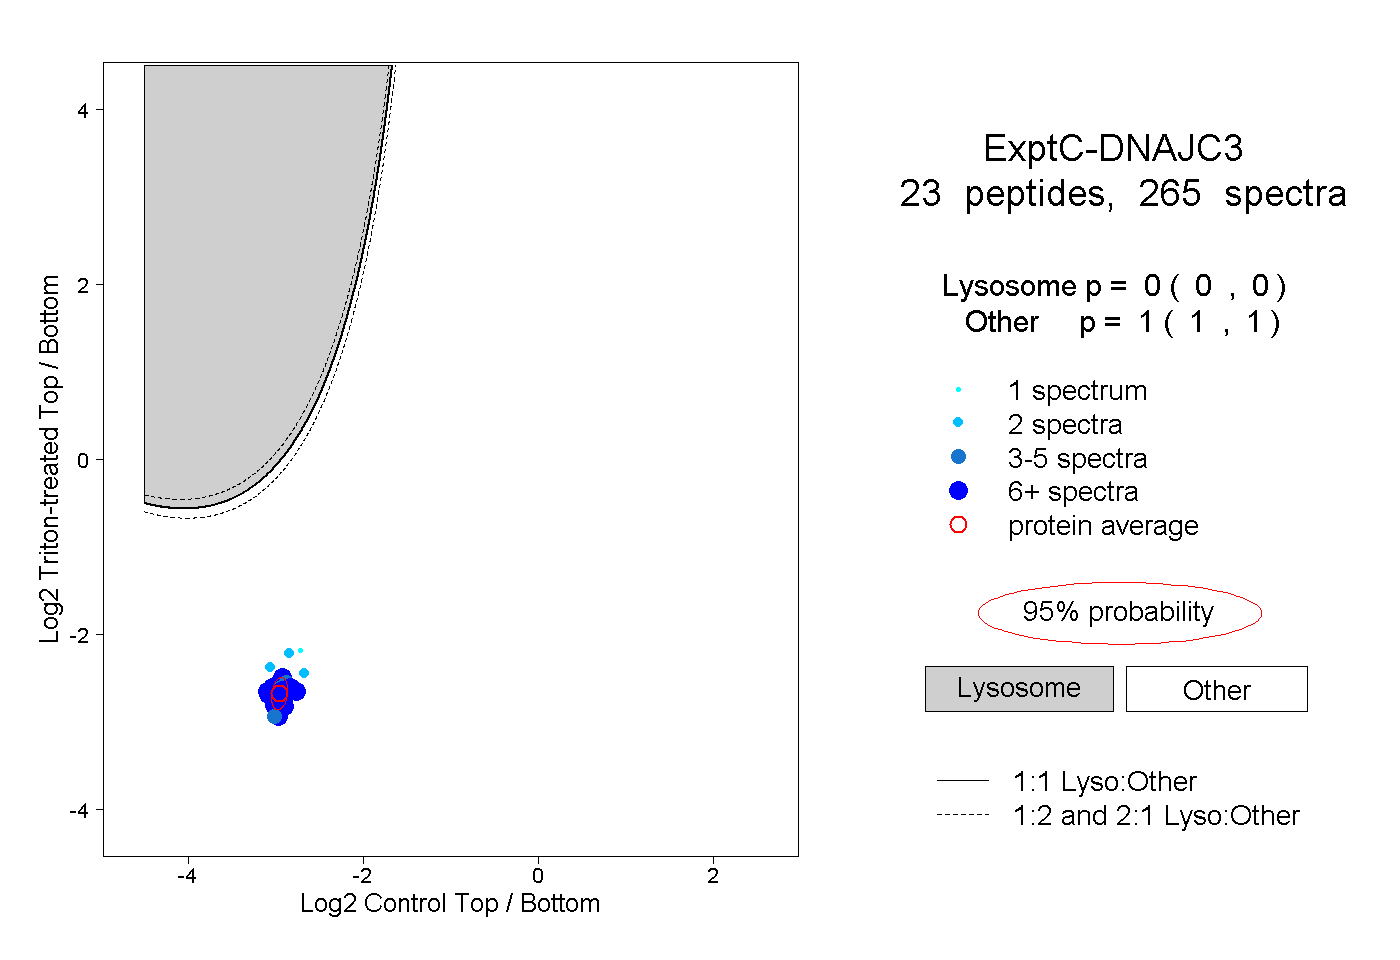
0.000 | 0.000
1.000 | 1.000
13peptides
spectra
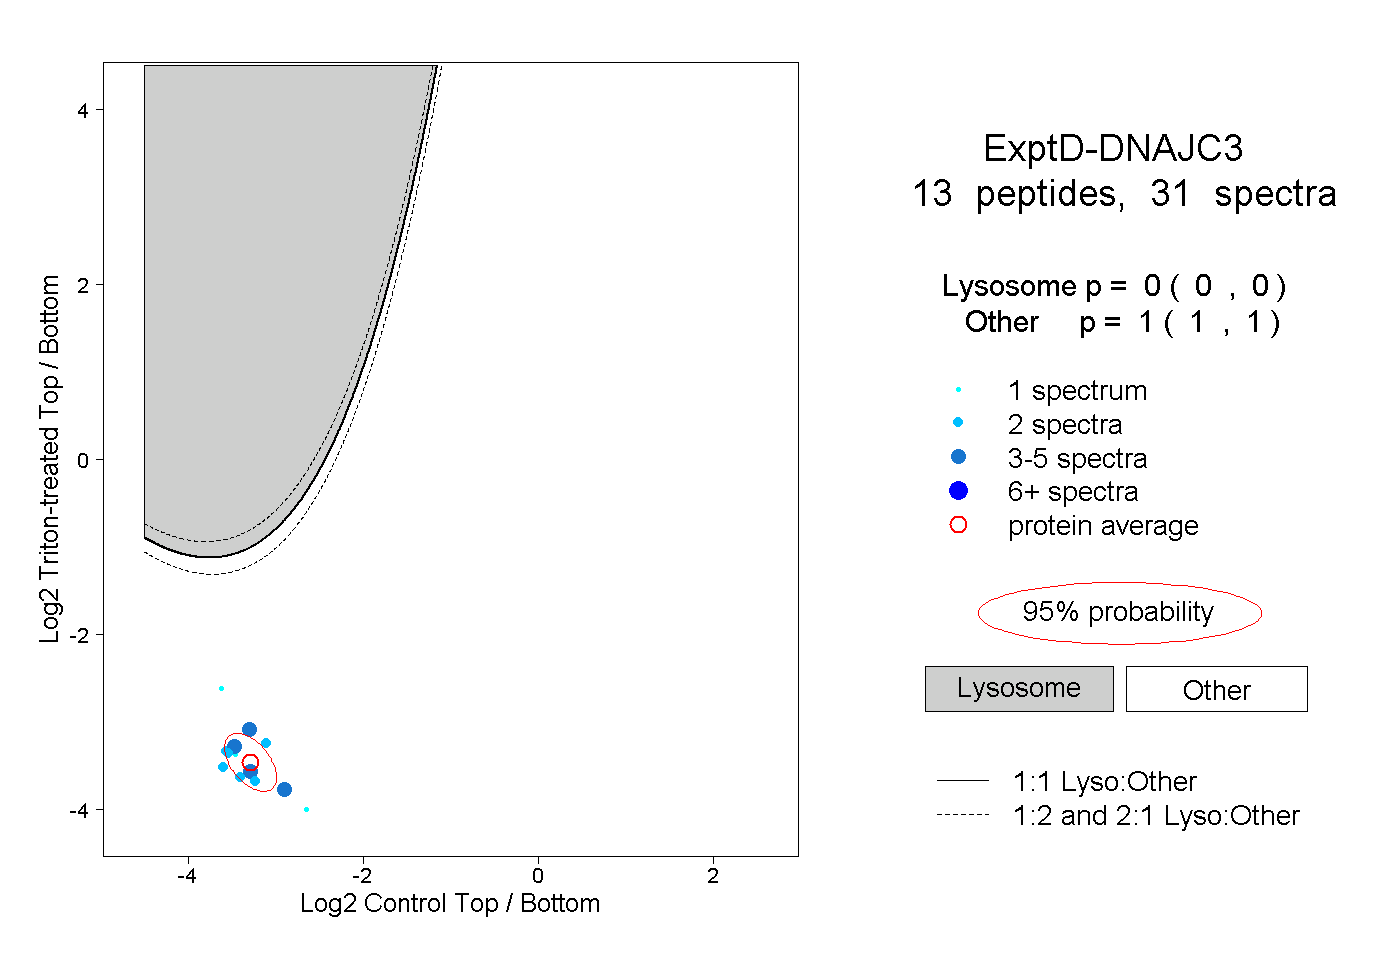
0.000 | 0.000
1.000 | 1.000