DNAJC3
[ENSRNOP00000014182]
Main page
| | | Plot |
Mito |
Lyso |
|
Perox |
ER |
Golgi |
PM |
Cytosol |
Nucleus |
|
| Expt A |
 23
23
peptides |
129
spectra |
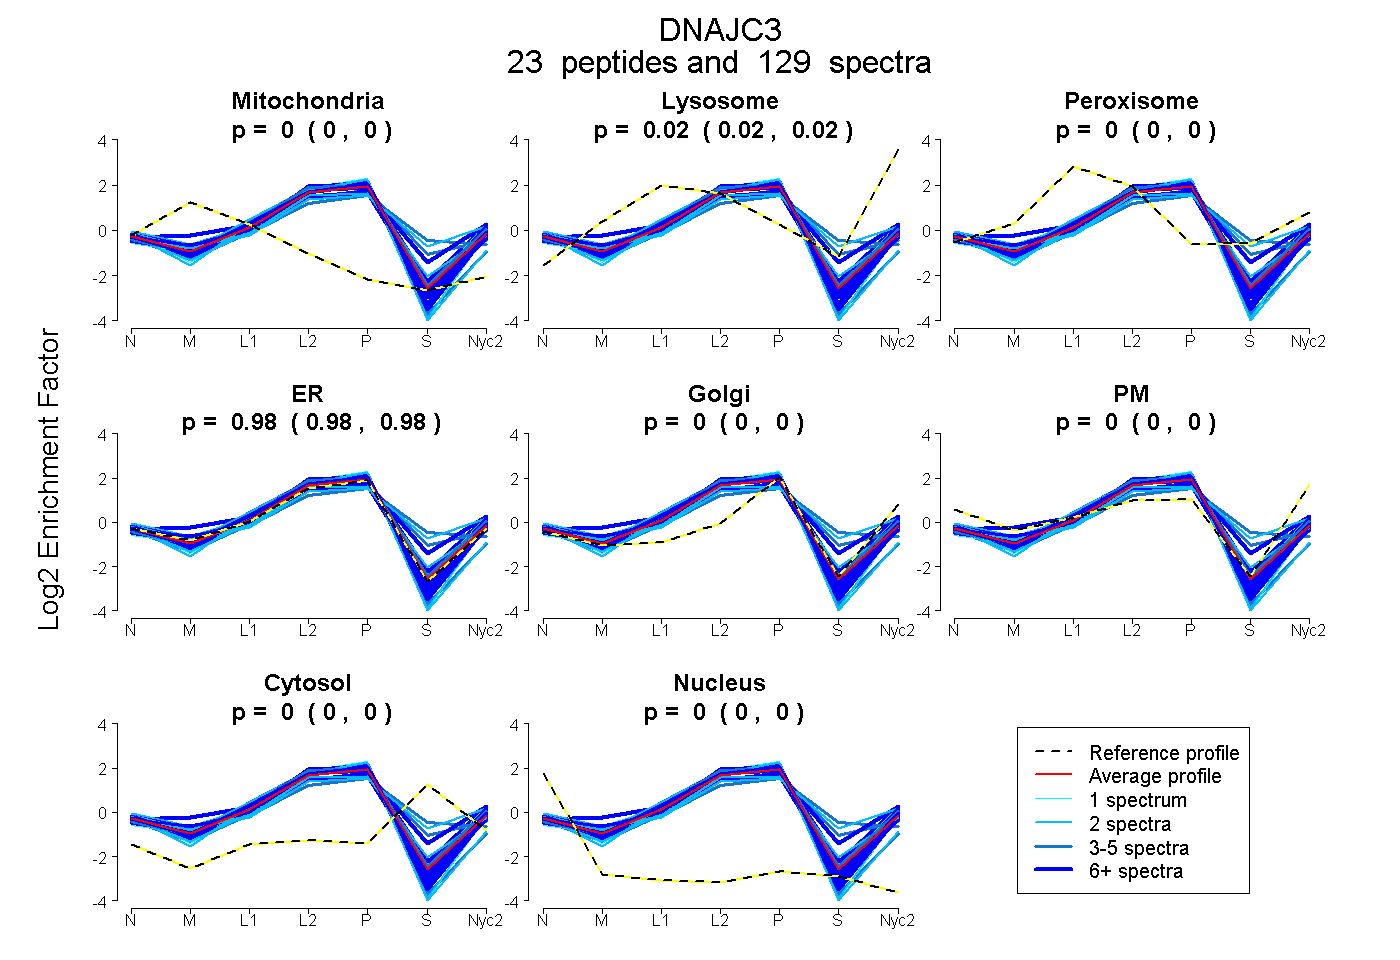 |
0.000
0.000 | 0.000 |
0.020
0.017 | 0.022 |
|
0.000
0.000 | 0.000 |
0.980
0.976 | 0.982 |
0.000
0.000 | 0.000 |
0.000
0.000 | 0.000 |
0.000
0.000 | 0.002 |
0.000
0.000 | 0.000 |
|
| | | Plot |
Mito |
|
Lyso or Perox |
|
ER |
Golgi |
PM |
Cytosol |
Nucleus |
|
| Expt B |
18
peptides |
66
spectra |
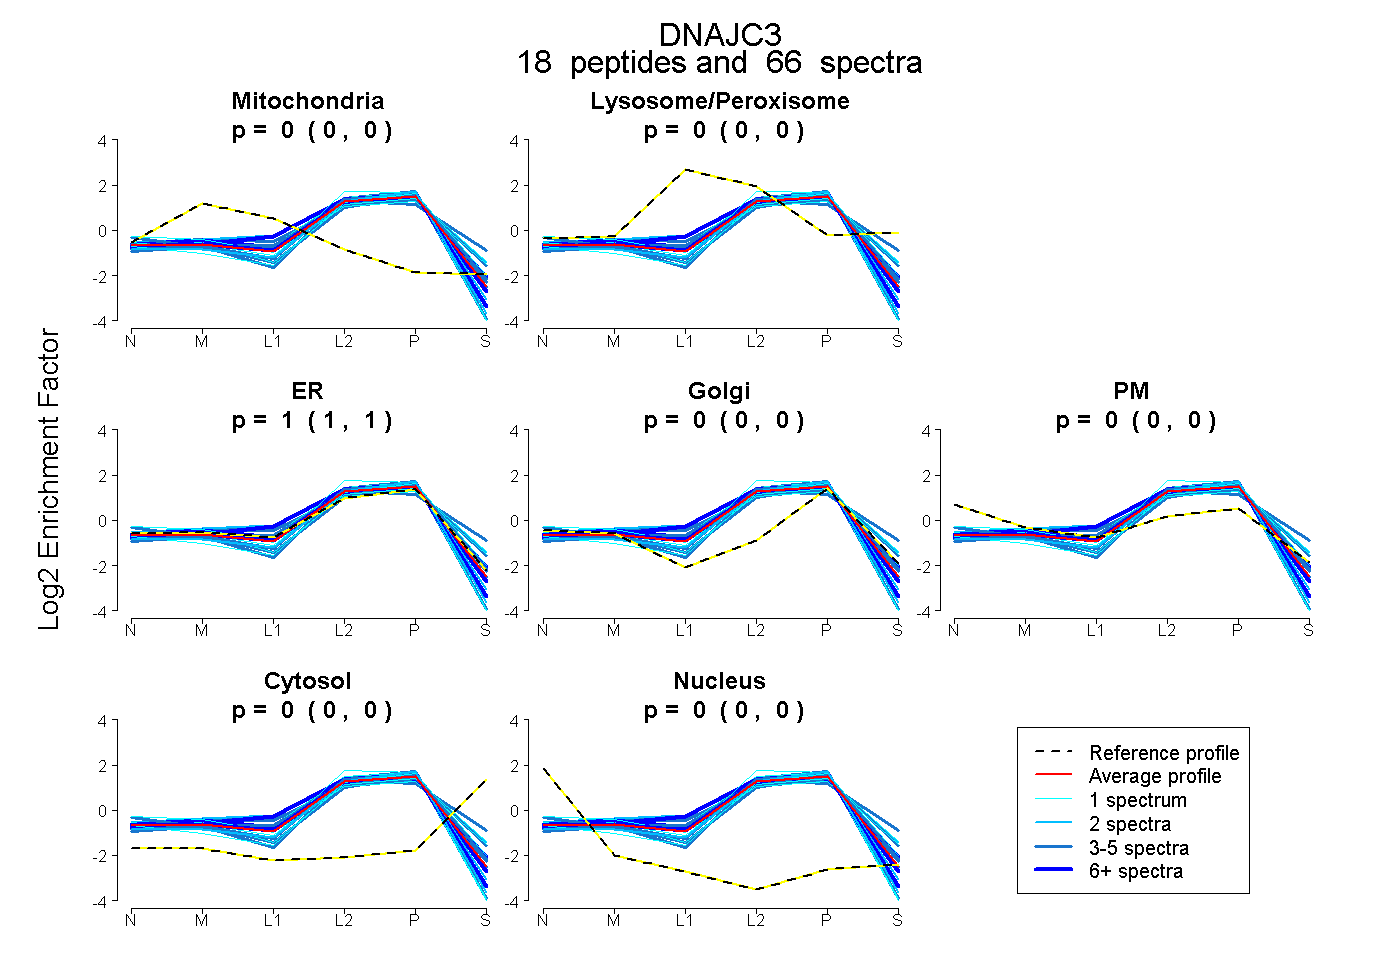 |
0.000
0.000 | 0.000 |
|
0.000
0.000 | 0.000 |
|
1.000
1.000 | 1.000 |
0.000
0.000 | 0.000 |
0.000
0.000 | 0.000 |
0.000
0.000 | 0.000 |
0.000
0.000 | 0.000 |
|
| | | Plot |
|
Lyso |
|
|
|
|
|
|
|
Other |
| Expt C |
23
peptides |
265
spectra |
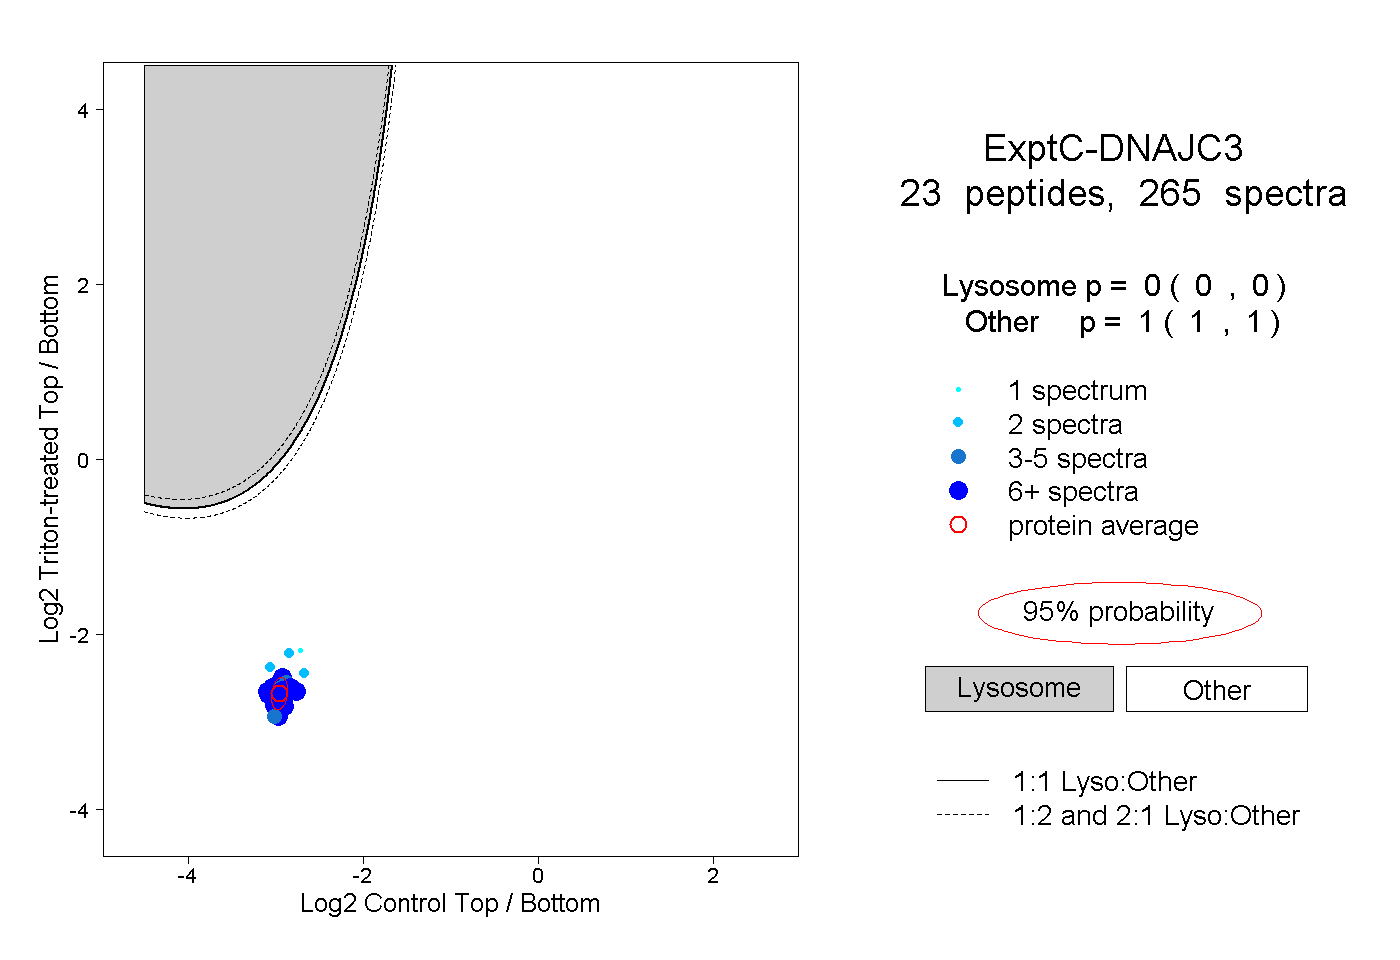 |
|
0.000
0.000 | 0.000 |
|
|
|
|
|
|
|
1.000
1.000 | 1.000 |
| | | Plot |
|
Lyso |
|
|
|
|
|
|
|
Other |
| Expt D |
13
peptides |
31
spectra |
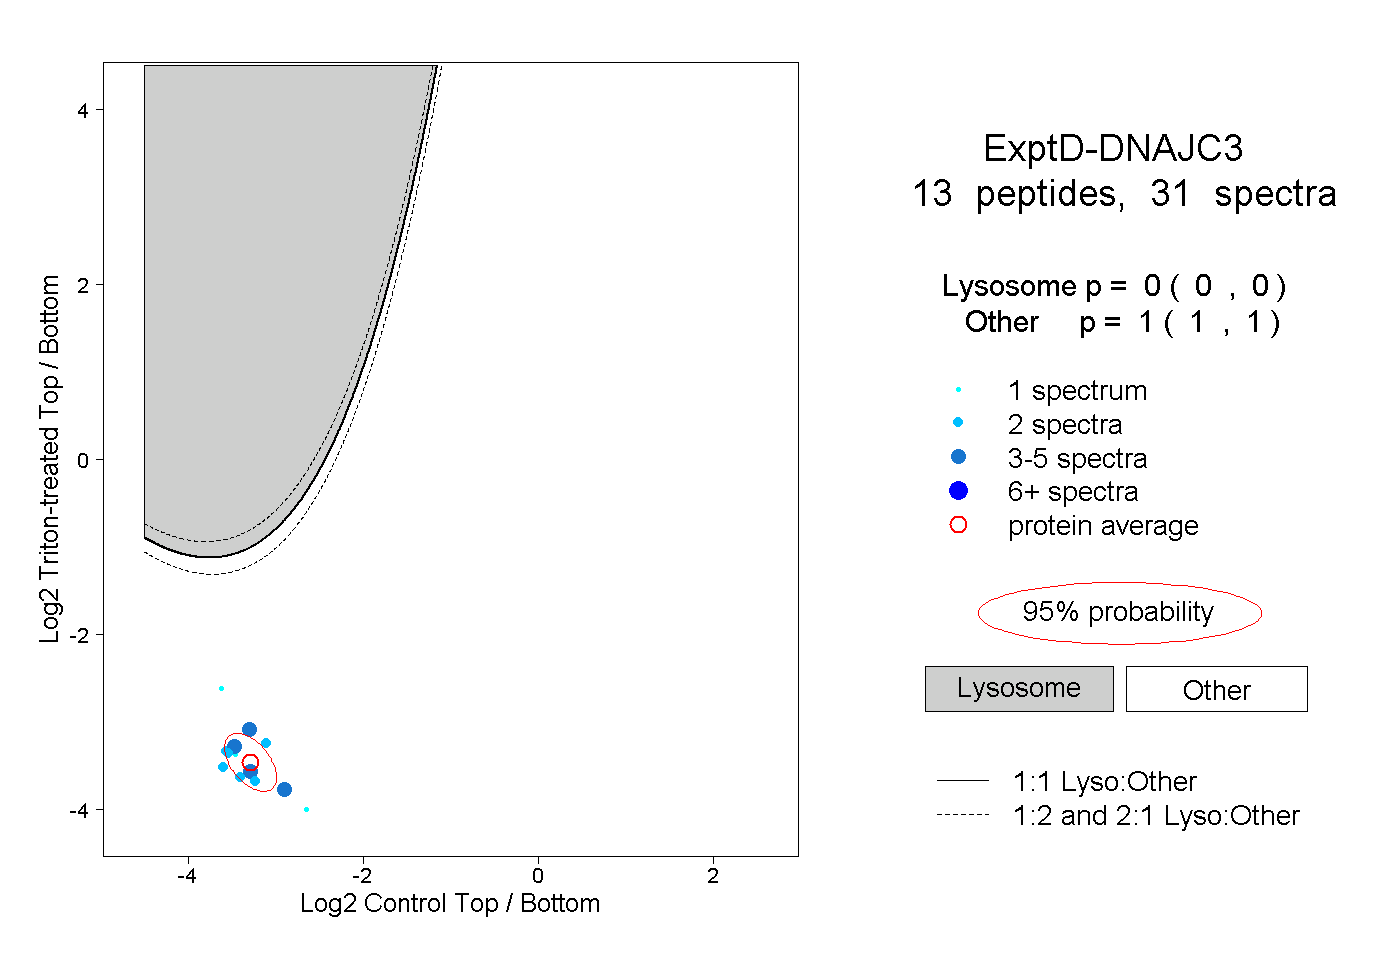 |
|
0.000
0.000 | 0.000 |
|
|
|
|
|
|
|
1.000
1.000 | 1.000 |
| 2 spectra, NDNTEAFYK |
|
0.000 |
|
|
|
|
|
|
|
1.000 |
| 2 spectra, AEPSVAEYTVR |
|
0.000 |
|
|
|
|
|
|
|
1.000 |
| 1 spectrum, EAQSQLVK |
|
0.000 |
|
|
|
|
|
|
|
1.000 |
| 3 spectra, MDFTAAR |
|
0.000 |
|
|
|
|
|
|
|
1.000 |
| 5 spectra, GHLLLK |
|
0.000 |
|
|
|
|
|
|
|
1.000 |
| 3 spectra, EVLSDPEMR |
|
0.000 |
|
|
|
|
|
|
|
1.000 |
| 2 spectra, ILGVK |
|
0.000 |
|
|
|
|
|
|
|
1.000 |
| 2 spectra, HLELGK |
|
0.000 |
|
|
|
|
|
|
|
1.000 |
| 5 spectra, AALPDLTR |
|
0.000 |
|
|
|
|
|
|
|
1.000 |
| 2 spectra, YTDATSK |
|
0.000 |
|
|
|
|
|
|
|
1.000 |
| 2 spectra, LIGSAEELIR |
|
0.000 |
|
|
|
|
|
|
|
1.000 |
| 1 spectrum, AECFIK |
|
0.000 |
|
|
|
|
|
|
|
1.000 |
| 1 spectrum, ATVFLAMGK |
|
0.000 |
|
|
|
|
|
|
|
1.000 |