 10
10peptides
spectra
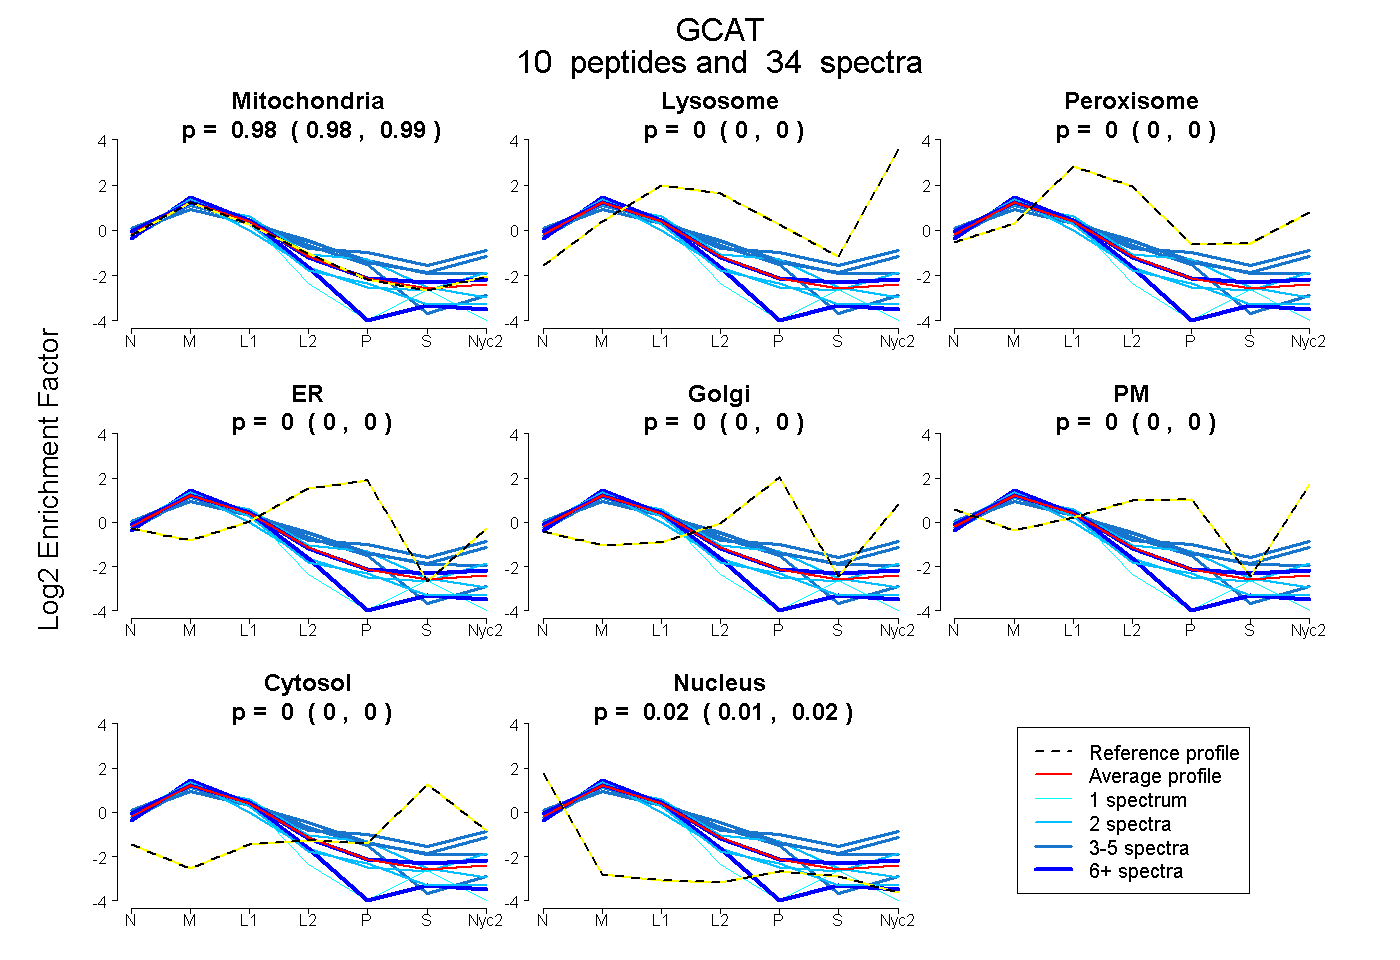
0.977 | 0.989
0.000 | 0.000
0.000 | 0.000
0.000 | 0.000
0.000 | 0.000
0.000 | 0.000
0.000 | 0.000
0.010 | 0.021
3peptides
spectra
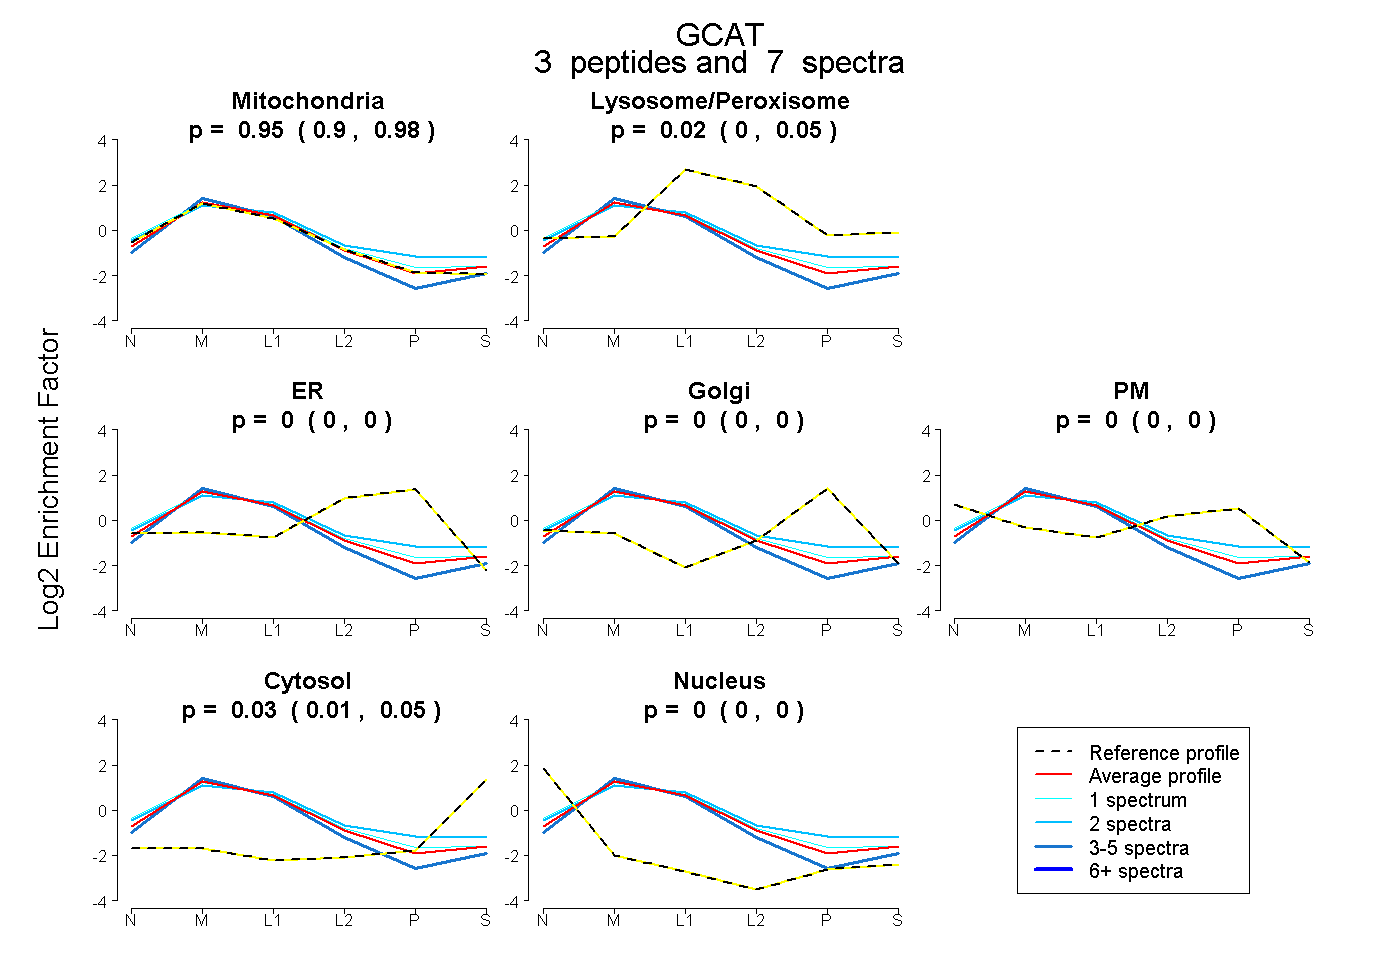
0.896 | 0.982
0.000 | 0.055
0.000 | 0.000
0.000 | 0.001
0.000 | 0.000
0.007 | 0.048
0.000 | 0.000
11peptides
spectra
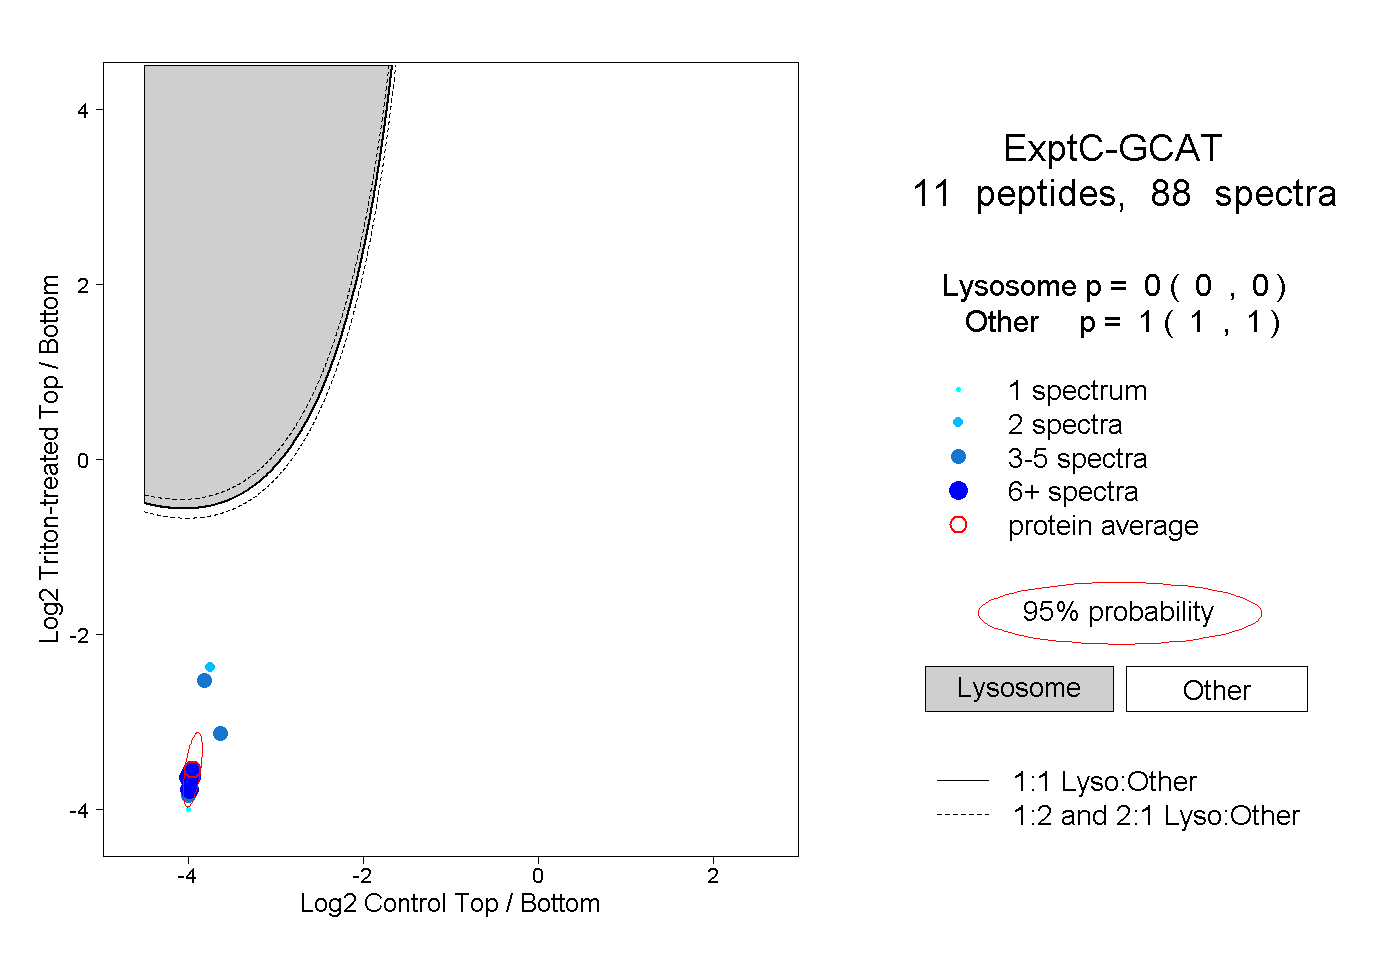
0.000 | 0.000
1.000 | 1.000
3peptides
spectra
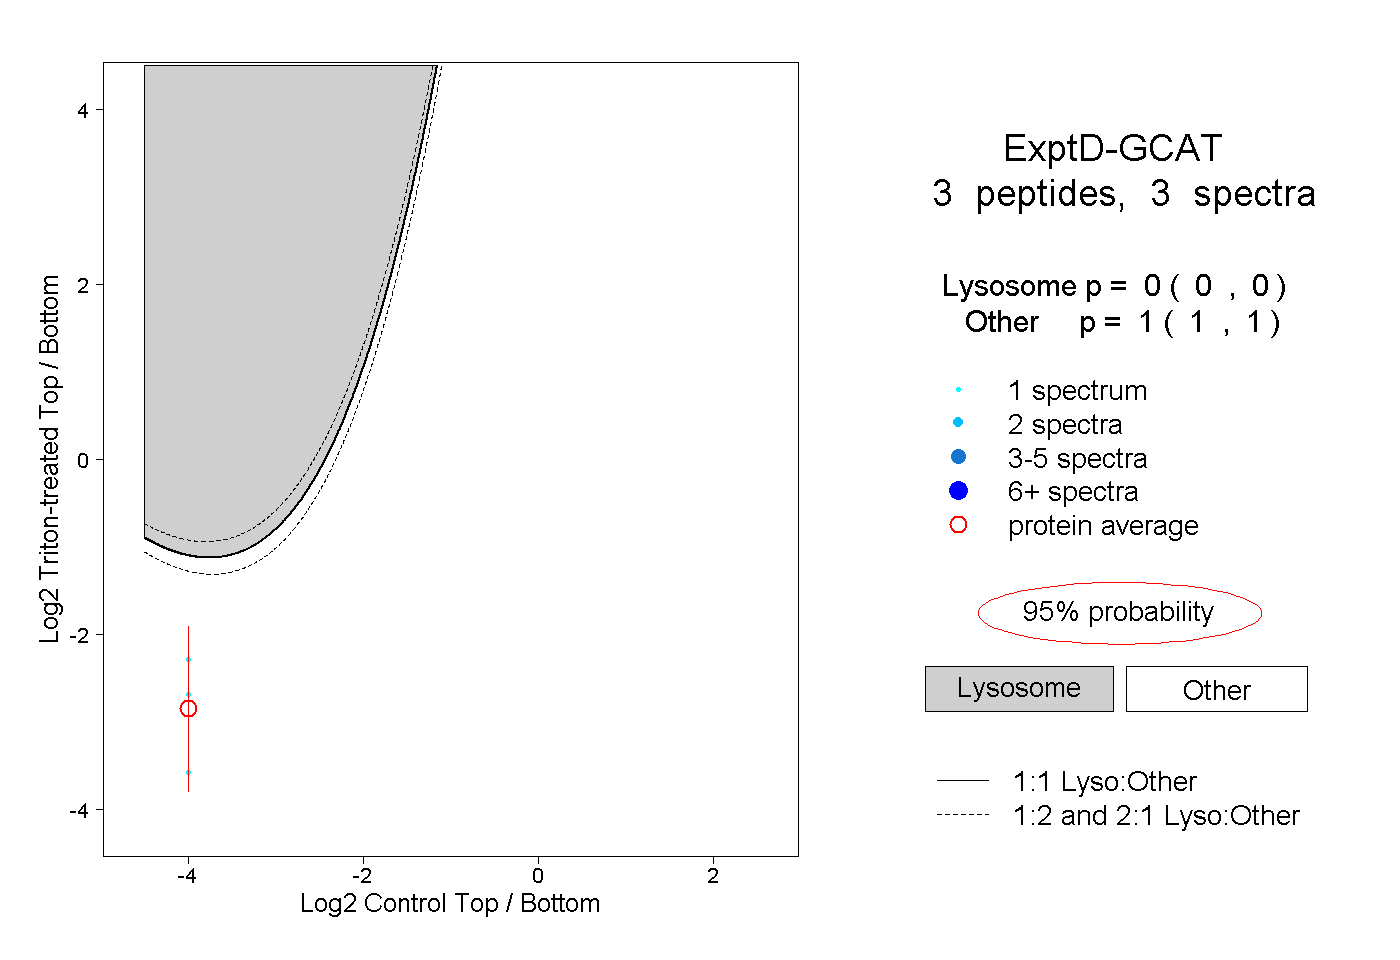
0.000 | 0.000
1.000 | 1.000