 10
10peptides
spectra
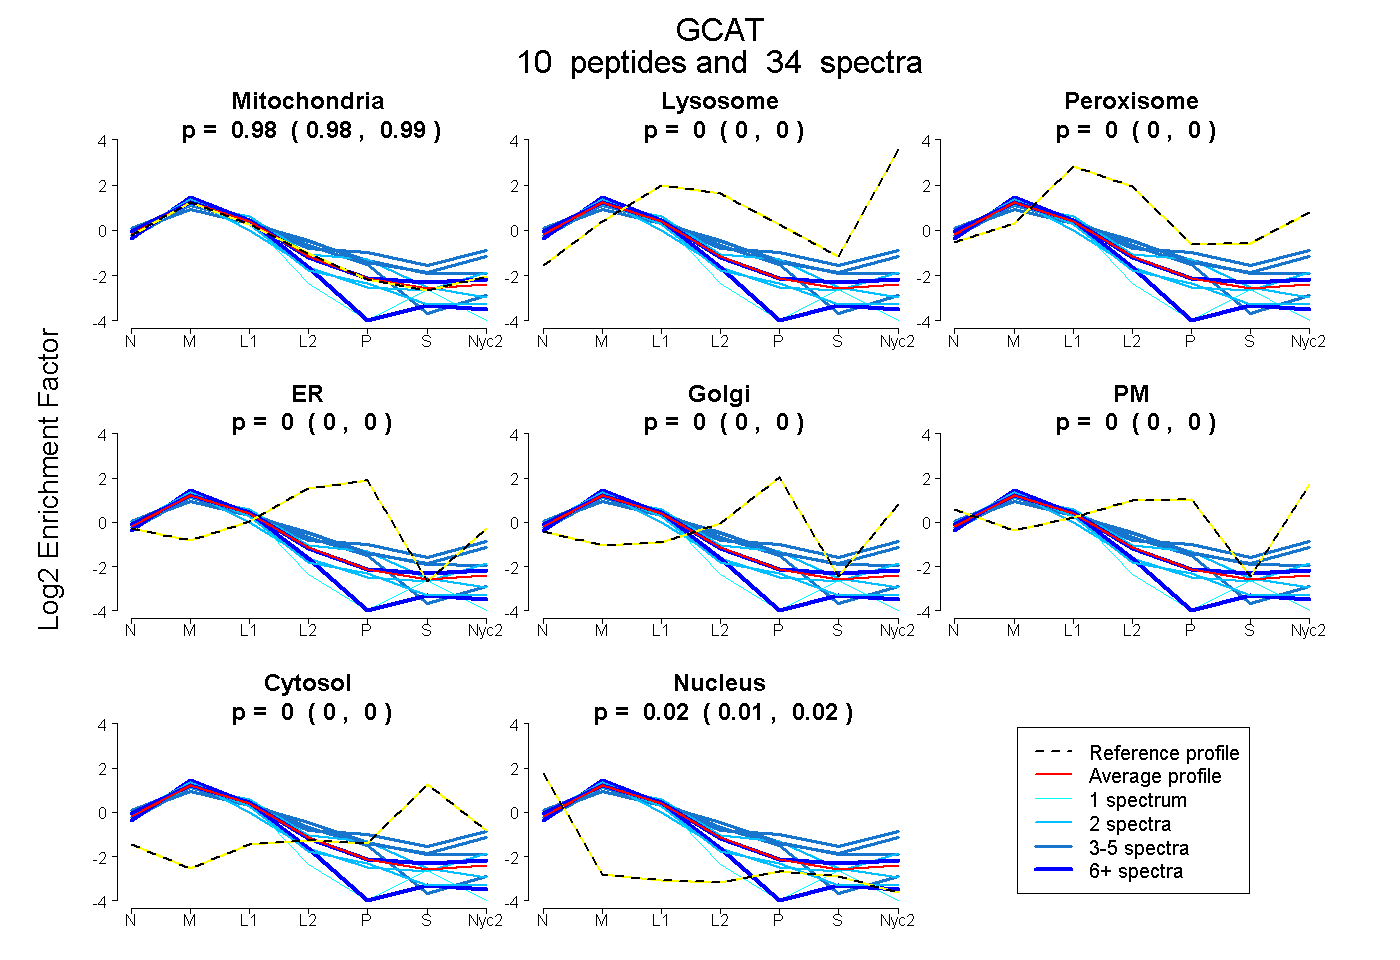
0.977 | 0.989
0.000 | 0.000
0.000 | 0.000
0.000 | 0.000
0.000 | 0.000
0.000 | 0.000
0.000 | 0.000
0.010 | 0.021
| Plot | Mito | Lyso | Perox | ER | Golgi | PM | Cytosol | Nucleus | |||||
| Expt A |
10 peptides |
34 spectra |
|
0.984 0.977 | 0.989 |
0.000 0.000 | 0.000 |
0.000 0.000 | 0.000 |
0.000 0.000 | 0.000 |
0.000 0.000 | 0.000 |
0.000 0.000 | 0.000 |
0.000 0.000 | 0.000 |
0.016 0.010 | 0.021 |
| 2 spectra, GTDELLGVMDQVTIINSTLGK | 0.904 | 0.000 | 0.000 | 0.069 | 0.000 | 0.000 | 0.000 | 0.027 | ||
| 3 spectra, HLDMADLEAK | 0.683 | 0.000 | 0.110 | 0.000 | 0.000 | 0.136 | 0.071 | 0.000 | ||
| 3 spectra, FICGTQSIHK | 0.654 | 0.112 | 0.057 | 0.000 | 0.102 | 0.000 | 0.076 | 0.000 | ||
| 3 spectra, CVEAFVEVGK | 0.888 | 0.000 | 0.000 | 0.080 | 0.000 | 0.000 | 0.000 | 0.032 | ||
| 2 spectra, QGPCIR | 0.905 | 0.000 | 0.000 | 0.000 | 0.000 | 0.000 | 0.000 | 0.095 | ||
| 7 spectra, MEAAGFTISGADHPICPVMLGDAR | 0.923 | 0.000 | 0.000 | 0.000 | 0.000 | 0.000 | 0.000 | 0.077 | ||
| 2 spectra, LSSQMAEDMLK | 0.968 | 0.000 | 0.000 | 0.000 | 0.000 | 0.000 | 0.000 | 0.032 | ||
| 1 spectrum, LVATDGAFSMDGDVAPLQEICR | 0.866 | 0.000 | 0.000 | 0.000 | 0.000 | 0.000 | 0.000 | 0.134 | ||
| 8 spectra, VQISAVHSEEDIDR | 0.972 | 0.000 | 0.005 | 0.000 | 0.000 | 0.000 | 0.023 | 0.000 | ||
| 3 spectra, GAGTWK | 0.781 | 0.000 | 0.081 | 0.094 | 0.000 | 0.000 | 0.044 | 0.000 |
| Plot | Mito | Lyso or Perox | ER | Golgi | PM | Cytosol | Nucleus | ||||||
| Expt B |
3 peptides |
7 spectra |
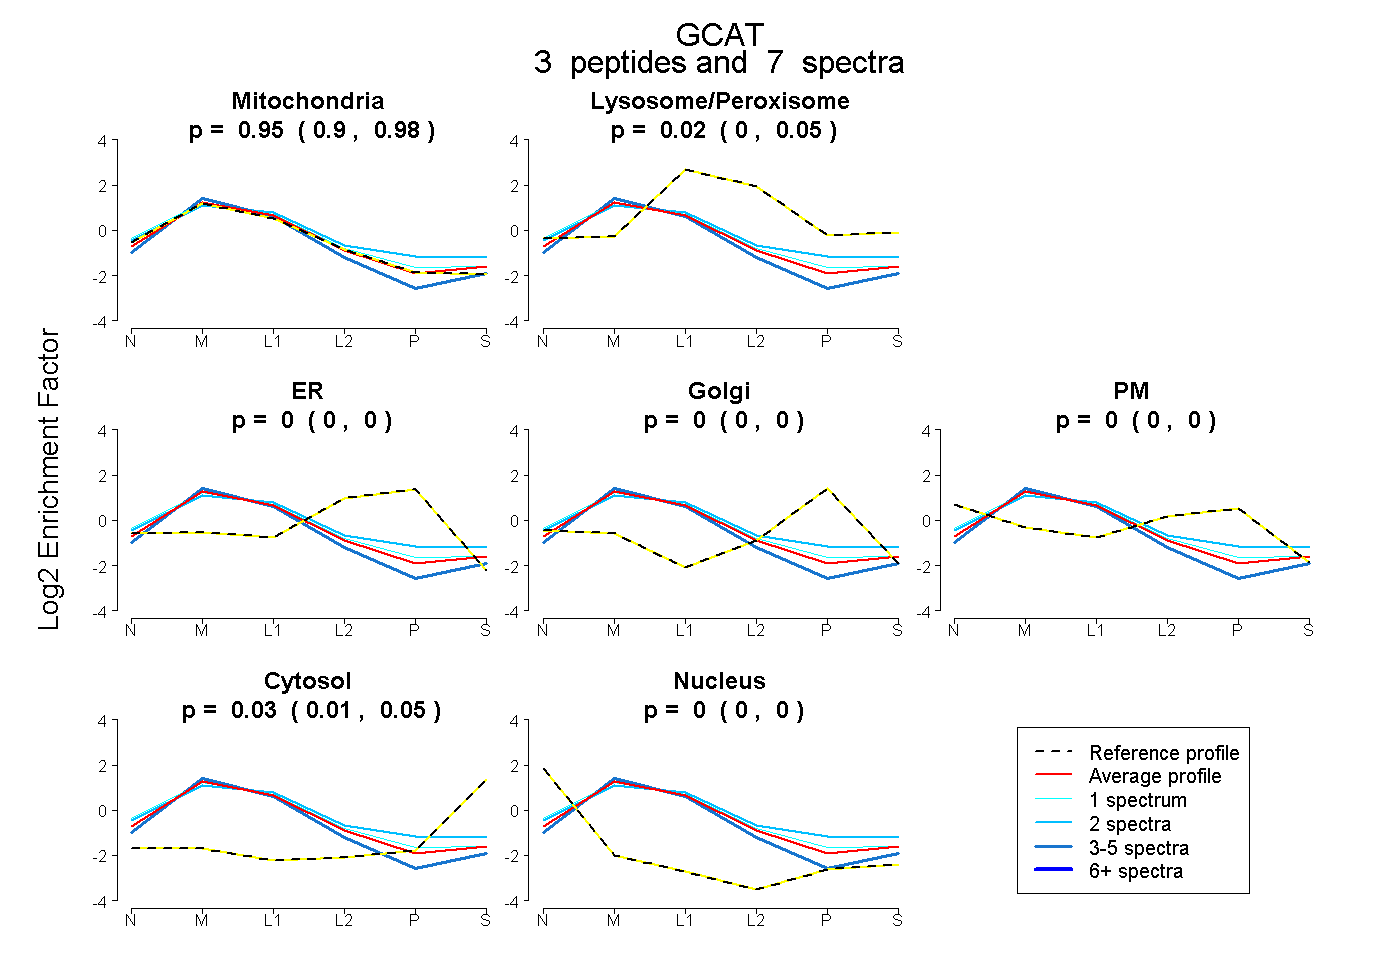 |
0.946 0.896 | 0.982 |
0.023 0.000 | 0.055 |
0.000 0.000 | 0.000 |
0.000 0.000 | 0.001 |
0.000 0.000 | 0.000 |
0.030 0.007 | 0.048 |
0.000 0.000 | 0.000 |
|||
| Plot | Lyso | Other | |||||||||||
| Expt C |
11 peptides |
88 spectra |
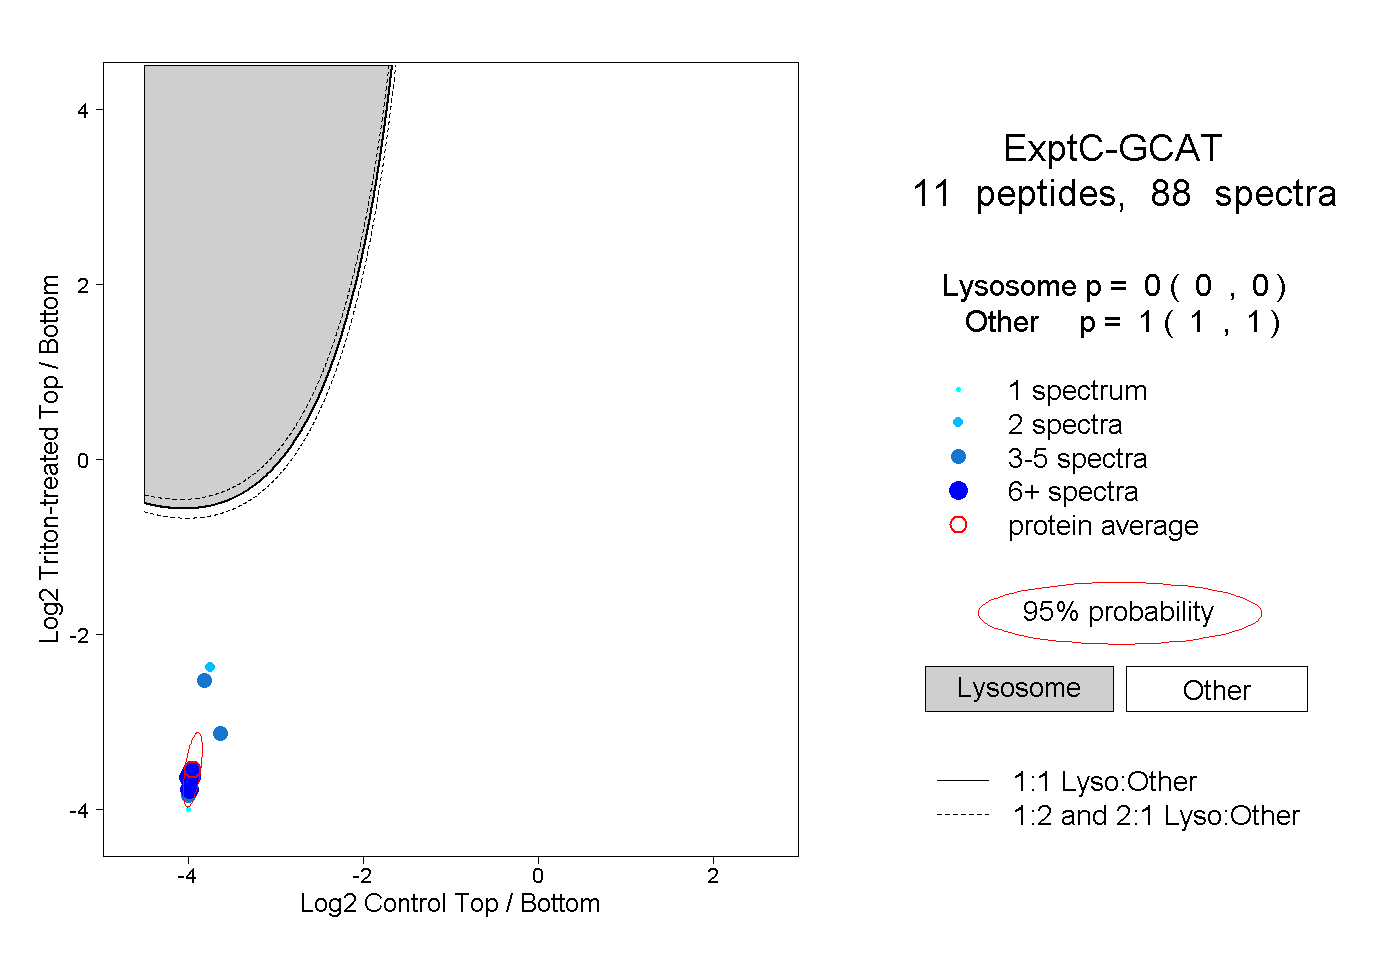 |
0.000 0.000 | 0.000 |
1.000 1.000 | 1.000 |
||||||||
| Plot | Lyso | Other | |||||||||||
| Expt D |
3 peptides |
3 spectra |
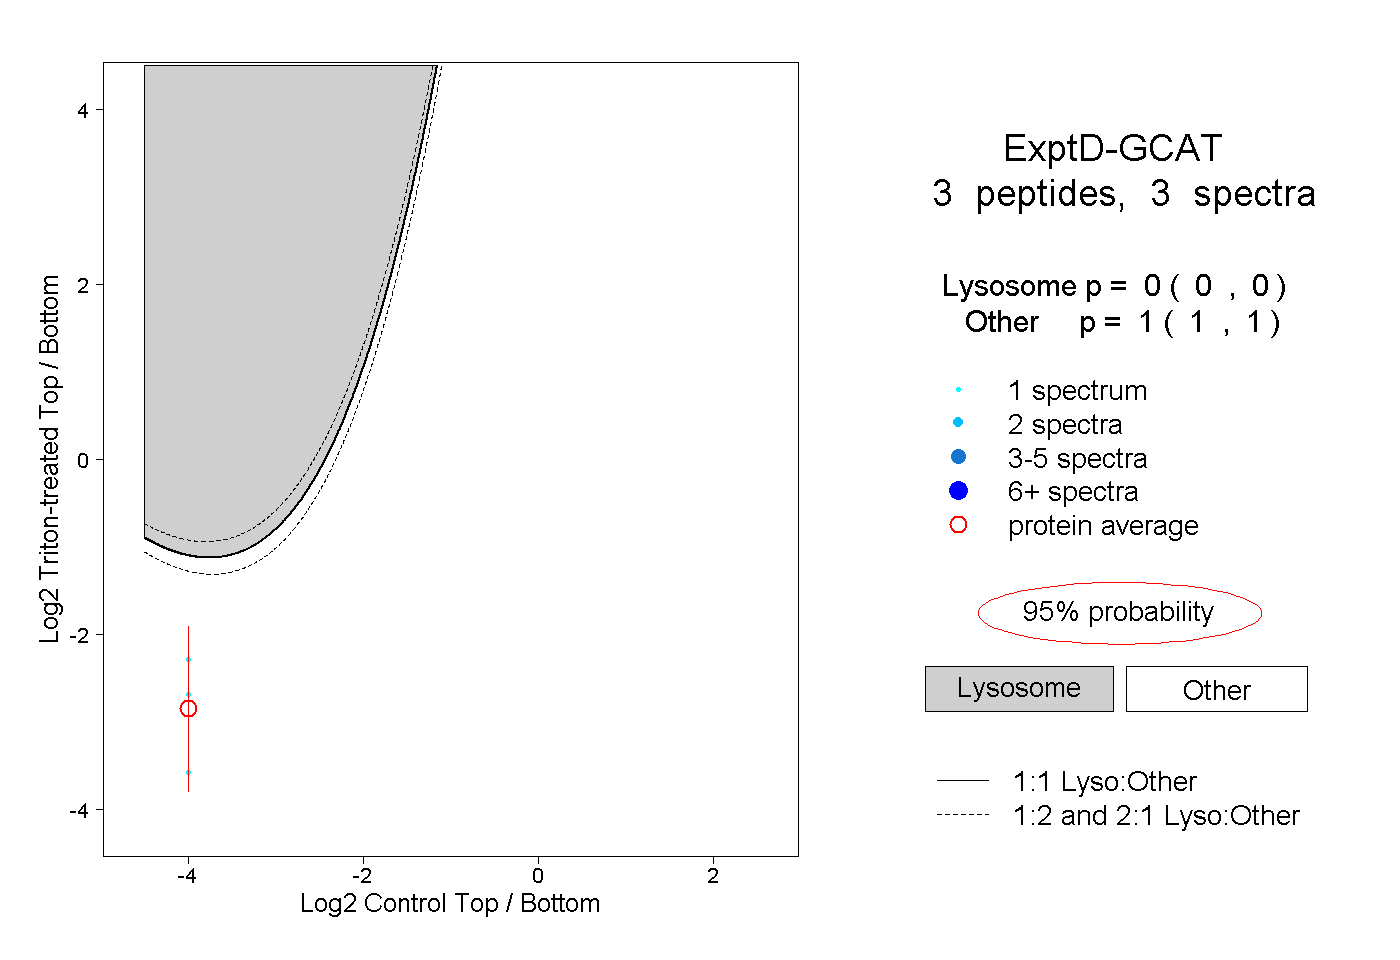 |
0.000 0.000 | 0.000 |
1.000 1.000 | 1.000 |