 44
44peptides
spectra
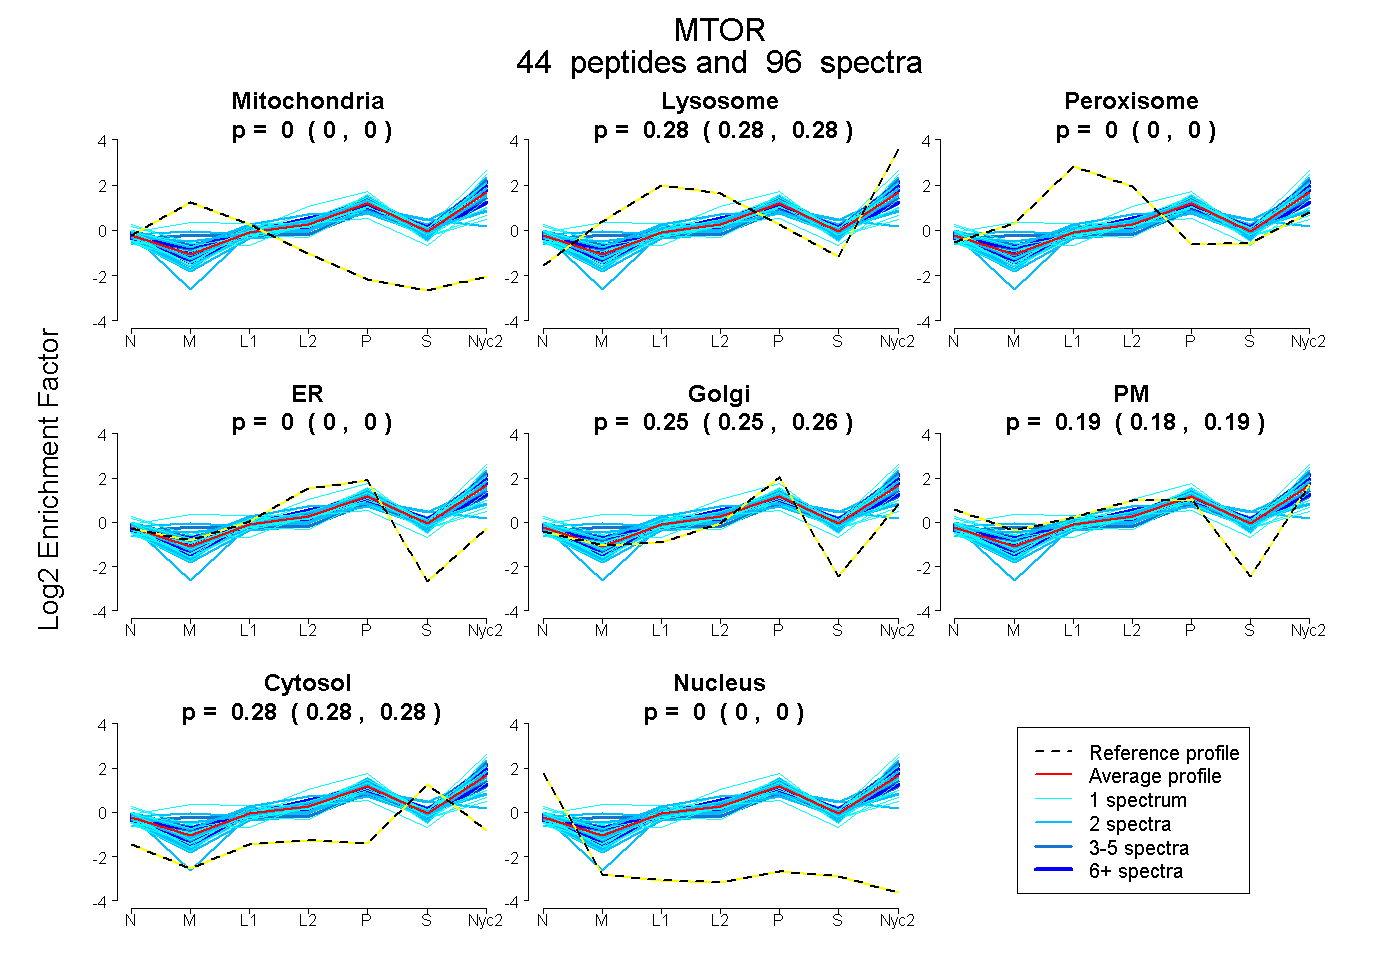
0.000 | 0.000
0.278 | 0.283
0.000 | 0.000
0.000 | 0.000
0.249 | 0.256
0.182 | 0.190
0.279 | 0.282
0.000 | 0.000
18peptides
spectra
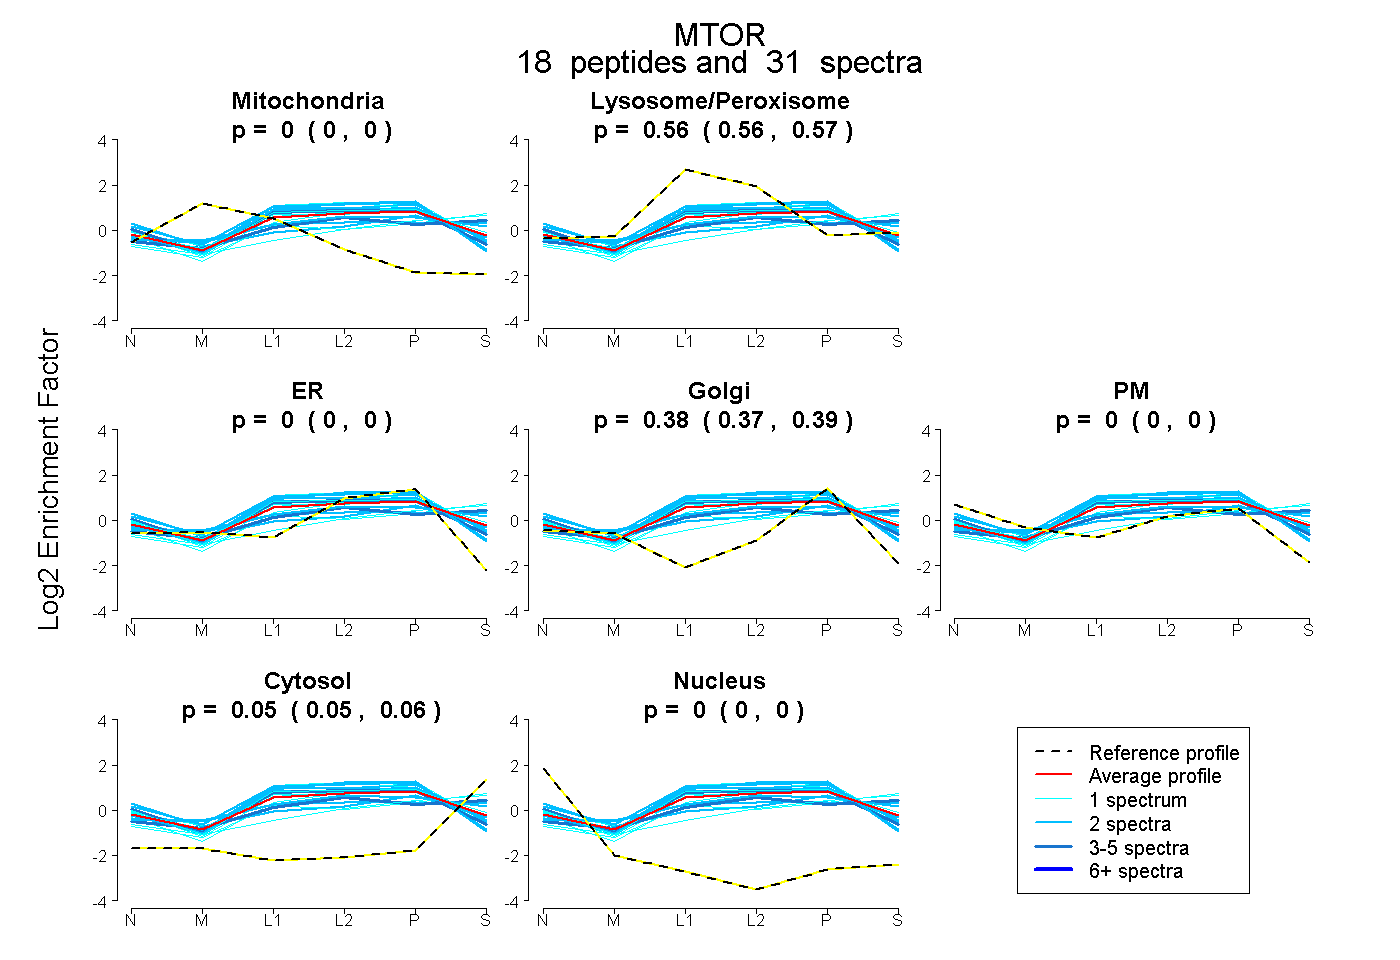
0.000 | 0.000
0.559 | 0.569
0.000 | 0.000
0.373 | 0.389
0.000 | 0.000
0.046 | 0.059
0.000 | 0.000
51peptides
spectra
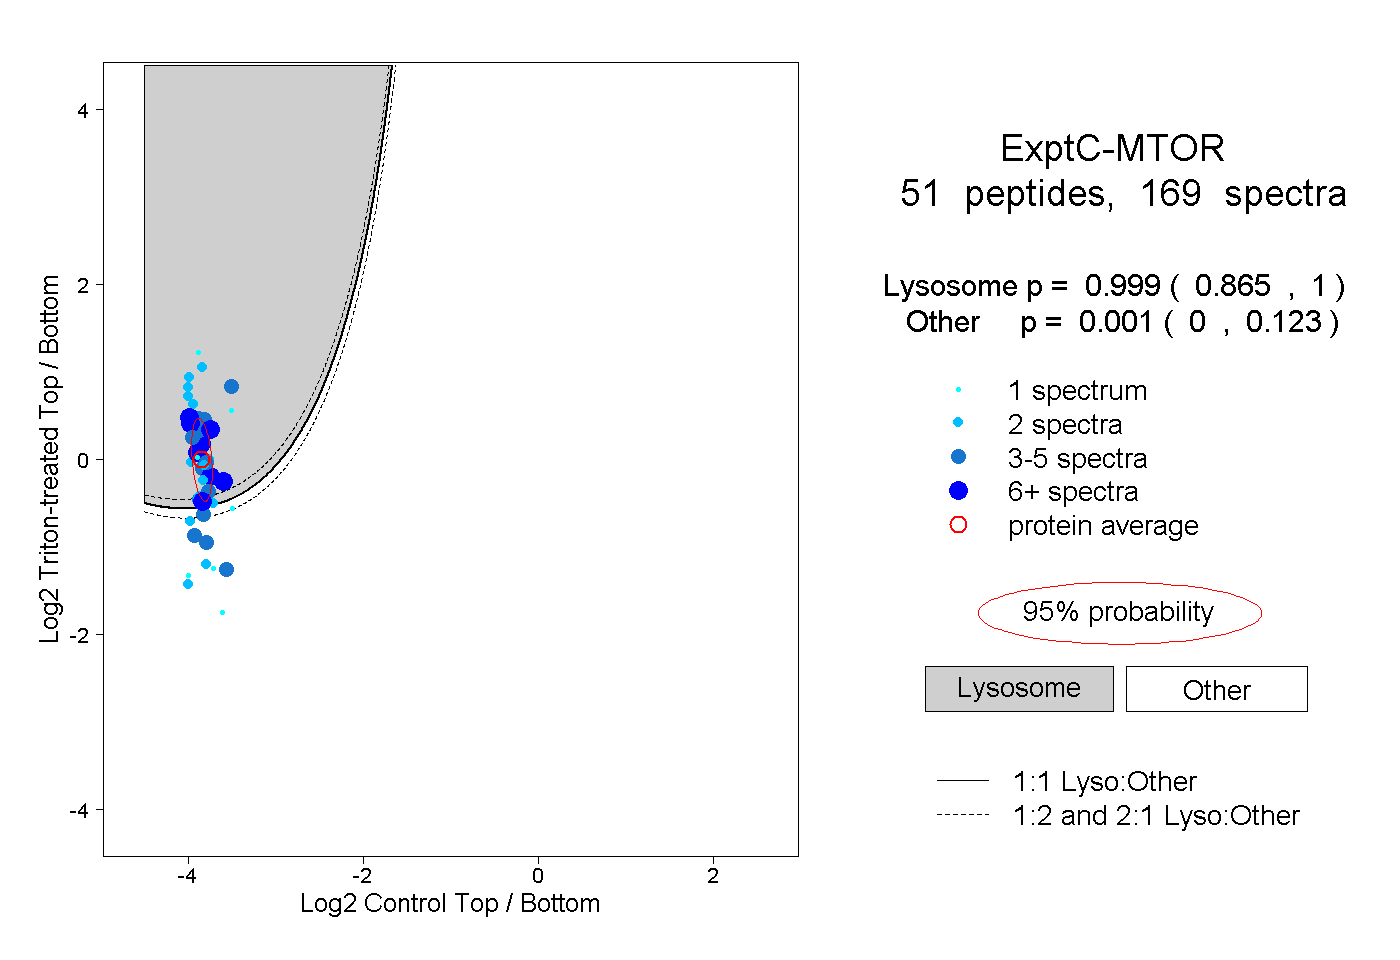
0.865 | 1.000
0.000 | 0.123
6peptides
spectra
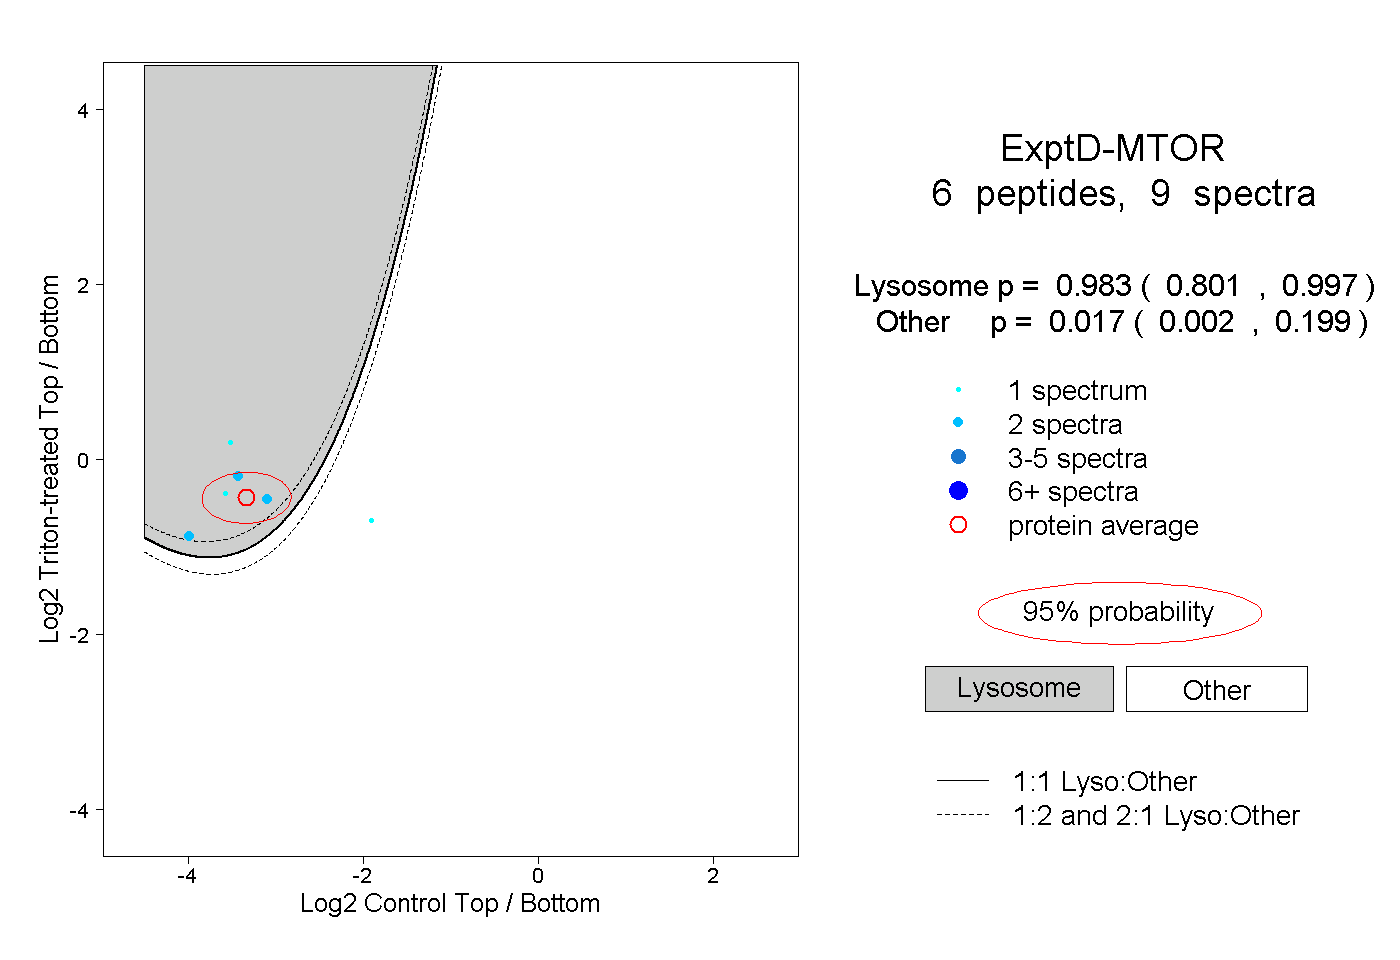
0.801 | 0.997
0.002 | 0.199