 44
44peptides
spectra
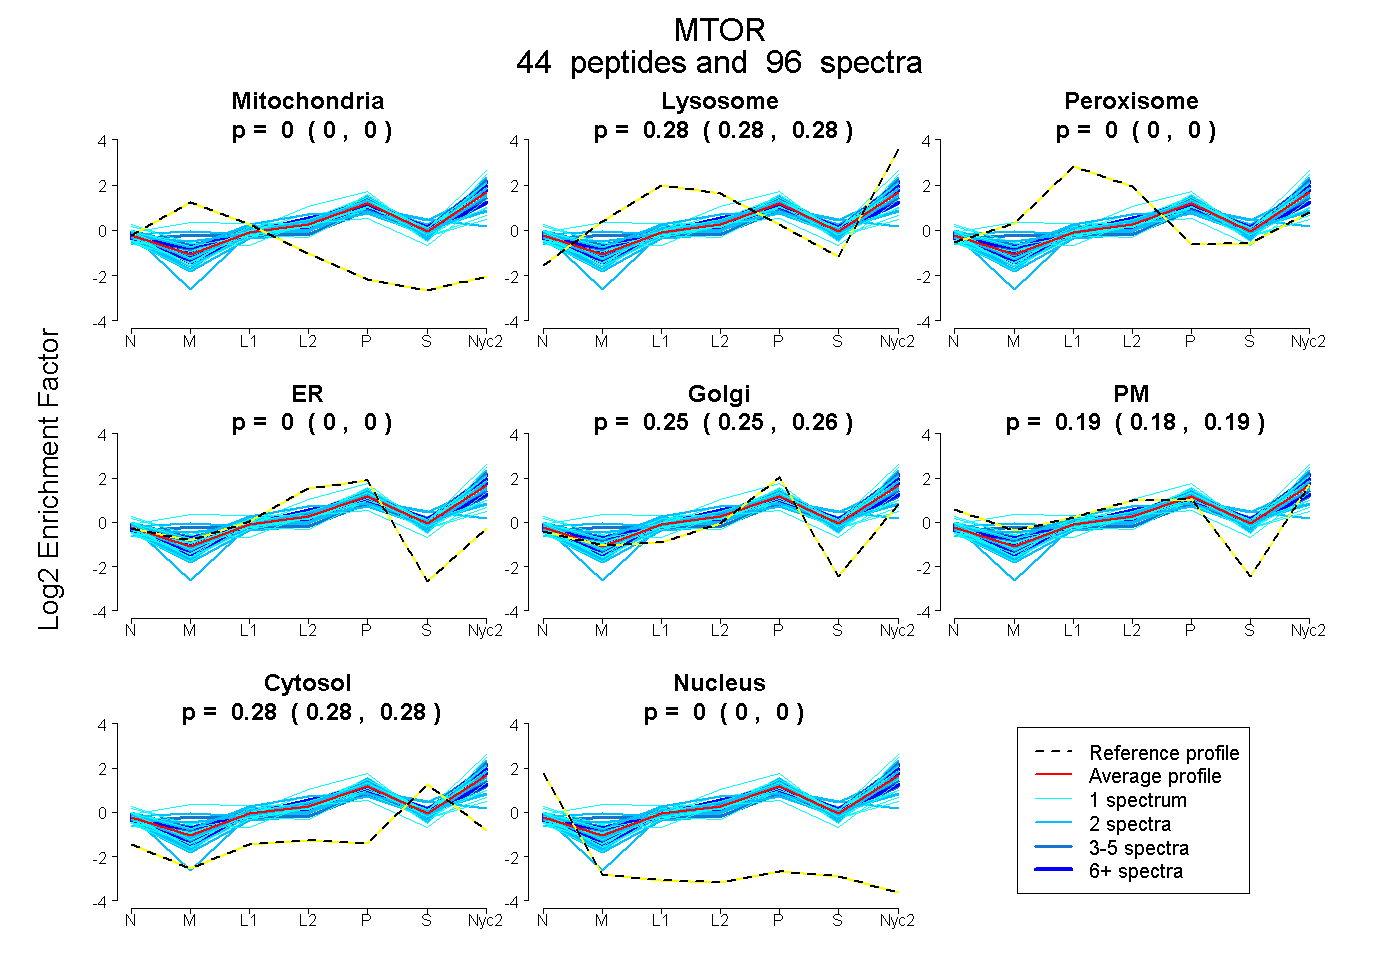
0.000 | 0.000
0.278 | 0.283
0.000 | 0.000
0.000 | 0.000
0.249 | 0.256
0.182 | 0.190
0.279 | 0.282
0.000 | 0.000
| Plot | Mito | Lyso | Perox | ER | Golgi | PM | Cytosol | Nucleus | |||||
| Expt A |
44 peptides |
96 spectra |
|
0.000 0.000 | 0.000 |
0.281 0.278 | 0.283 |
0.000 0.000 | 0.000 |
0.000 0.000 | 0.000 |
0.253 0.249 | 0.256 |
0.186 0.182 | 0.190 |
0.280 0.279 | 0.282 |
0.000 0.000 | 0.000 |
| 1 spectrum, YHPQALIYPLTVASK | 0.000 | 0.223 | 0.000 | 0.000 | 0.140 | 0.303 | 0.335 | 0.000 | ||
| 2 spectra, QIWWER | 0.000 | 0.314 | 0.000 | 0.000 | 0.255 | 0.199 | 0.232 | 0.000 | ||
| 3 spectra, DIQDGLLK | 0.000 | 0.215 | 0.003 | 0.000 | 0.062 | 0.419 | 0.303 | 0.000 | ||
| 2 spectra, DSSSPSLR | 0.000 | 0.217 | 0.000 | 0.000 | 0.244 | 0.290 | 0.249 | 0.000 | ||
| 1 spectrum, VEVFEHAVNNTAGDDLAK | 0.000 | 0.341 | 0.000 | 0.000 | 0.280 | 0.118 | 0.261 | 0.000 | ||
| 2 spectra, VNIGMIDQSR | 0.000 | 0.328 | 0.000 | 0.000 | 0.326 | 0.148 | 0.198 | 0.000 | ||
| 1 spectrum, IVEDWQK | 0.000 | 0.425 | 0.000 | 0.000 | 0.282 | 0.063 | 0.229 | 0.000 | ||
| 8 spectra, HAAVLVLR | 0.000 | 0.298 | 0.000 | 0.000 | 0.266 | 0.198 | 0.239 | 0.000 | ||
| 2 spectra, AIQIINR | 0.000 | 0.208 | 0.000 | 0.000 | 0.369 | 0.090 | 0.333 | 0.000 | ||
| 1 spectrum, VDLLLR | 0.000 | 0.245 | 0.000 | 0.000 | 0.321 | 0.151 | 0.283 | 0.000 | ||
| 4 spectra, ELQHYVTMELR | 0.000 | 0.243 | 0.014 | 0.000 | 0.249 | 0.177 | 0.316 | 0.000 | ||
| 1 spectrum, ELEFQK | 0.000 | 0.257 | 0.000 | 0.000 | 0.245 | 0.180 | 0.317 | 0.000 | ||
| 2 spectra, TTCHTVMEVLR | 0.000 | 0.101 | 0.154 | 0.000 | 0.396 | 0.070 | 0.279 | 0.000 | ||
| 1 spectrum, SLVVSPHEDMR | 0.000 | 0.000 | 0.165 | 0.151 | 0.000 | 0.402 | 0.282 | 0.000 | ||
| 1 spectrum, SCWALAQAYNPMAR | 0.000 | 0.176 | 0.095 | 0.000 | 0.451 | 0.000 | 0.278 | 0.000 | ||
| 3 spectra, LIRPYMEPILK | 0.000 | 0.387 | 0.000 | 0.000 | 0.346 | 0.083 | 0.185 | 0.000 | ||
| 1 spectrum, GMFEVLEPLHAMMER | 0.000 | 0.350 | 0.000 | 0.000 | 0.398 | 0.073 | 0.179 | 0.000 | ||
| 1 spectrum, QLDHPLPTVHPQVTYAYMK | 0.072 | 0.240 | 0.063 | 0.000 | 0.032 | 0.414 | 0.179 | 0.000 | ||
| 7 spectra, MLGHLVSNAPR | 0.000 | 0.239 | 0.066 | 0.000 | 0.262 | 0.157 | 0.276 | 0.000 | ||
| 1 spectrum, WTLVNDETQAK | 0.000 | 0.104 | 0.067 | 0.000 | 0.236 | 0.303 | 0.290 | 0.000 | ||
| 2 spectra, DTHDGAFYR | 0.000 | 0.263 | 0.000 | 0.000 | 0.144 | 0.261 | 0.332 | 0.000 | ||
| 2 spectra, ALEWLGADR | 0.000 | 0.337 | 0.000 | 0.000 | 0.258 | 0.103 | 0.302 | 0.000 | ||
| 1 spectrum, DLLDAELTAMAGESYSR | 0.000 | 0.315 | 0.000 | 0.000 | 0.368 | 0.044 | 0.274 | 0.000 | ||
| 9 spectra, IIHPIVR | 0.000 | 0.263 | 0.000 | 0.000 | 0.204 | 0.212 | 0.321 | 0.000 | ||
| 2 spectra, GNNLQDTLR | 0.000 | 0.316 | 0.000 | 0.000 | 0.351 | 0.079 | 0.253 | 0.000 | ||
| 1 spectrum, SPSSEVWFDR | 0.000 | 0.381 | 0.000 | 0.000 | 0.293 | 0.052 | 0.274 | 0.000 | ||
| 1 spectrum, QIPQLK | 0.000 | 0.359 | 0.000 | 0.000 | 0.334 | 0.024 | 0.283 | 0.000 | ||
| 2 spectra, DDPELMLGR | 0.000 | 0.367 | 0.000 | 0.000 | 0.276 | 0.045 | 0.313 | 0.000 | ||
| 1 spectrum, GYTLADEEEDPLIYQHR | 0.000 | 0.050 | 0.000 | 0.000 | 0.021 | 0.620 | 0.310 | 0.000 | ||
| 2 spectra, AMGPGIQQDIK | 0.000 | 0.347 | 0.000 | 0.000 | 0.208 | 0.073 | 0.373 | 0.000 | ||
| 3 spectra, HTFEEAEK | 0.000 | 0.300 | 0.000 | 0.000 | 0.121 | 0.279 | 0.301 | 0.000 | ||
| 1 spectrum, LHVSTINLQK | 0.000 | 0.193 | 0.000 | 0.000 | 0.206 | 0.280 | 0.320 | 0.000 | ||
| 2 spectra, ELAICTVGR | 0.000 | 0.000 | 0.153 | 0.000 | 0.395 | 0.000 | 0.452 | 0.000 | ||
| 2 spectra, DDWLEWLR | 0.000 | 0.353 | 0.000 | 0.000 | 0.370 | 0.000 | 0.277 | 0.000 | ||
| 1 spectrum, EMSQEESTR | 0.000 | 0.372 | 0.000 | 0.000 | 0.409 | 0.000 | 0.220 | 0.000 | ||
| 1 spectrum, LSLELLK | 0.000 | 0.393 | 0.000 | 0.000 | 0.367 | 0.000 | 0.240 | 0.000 | ||
| 2 spectra, FANYLR | 0.000 | 0.333 | 0.000 | 0.000 | 0.249 | 0.258 | 0.160 | 0.000 | ||
| 1 spectrum, IQSIAPSLQVITSK | 0.000 | 0.358 | 0.000 | 0.000 | 0.251 | 0.250 | 0.141 | 0.000 | ||
| 2 spectra, GHEDLR | 0.000 | 0.348 | 0.000 | 0.000 | 0.327 | 0.047 | 0.278 | 0.000 | ||
| 6 spectra, ILLNIEHR | 0.000 | 0.336 | 0.000 | 0.000 | 0.302 | 0.117 | 0.245 | 0.000 | ||
| 2 spectra, LALAHK | 0.000 | 0.333 | 0.000 | 0.000 | 0.418 | 0.062 | 0.187 | 0.000 | ||
| 1 spectrum, STAMDTLSSLVFQLGK | 0.000 | 0.179 | 0.000 | 0.436 | 0.114 | 0.000 | 0.272 | 0.000 | ||
| 2 spectra, VFMHDNSQGR | 0.000 | 0.047 | 0.273 | 0.000 | 0.198 | 0.219 | 0.264 | 0.000 | ||
| 2 spectra, NLSIQR | 0.000 | 0.267 | 0.000 | 0.000 | 0.080 | 0.369 | 0.284 | 0.000 |
| Plot | Mito | Lyso or Perox | ER | Golgi | PM | Cytosol | Nucleus | ||||||
| Expt B |
18 peptides |
31 spectra |
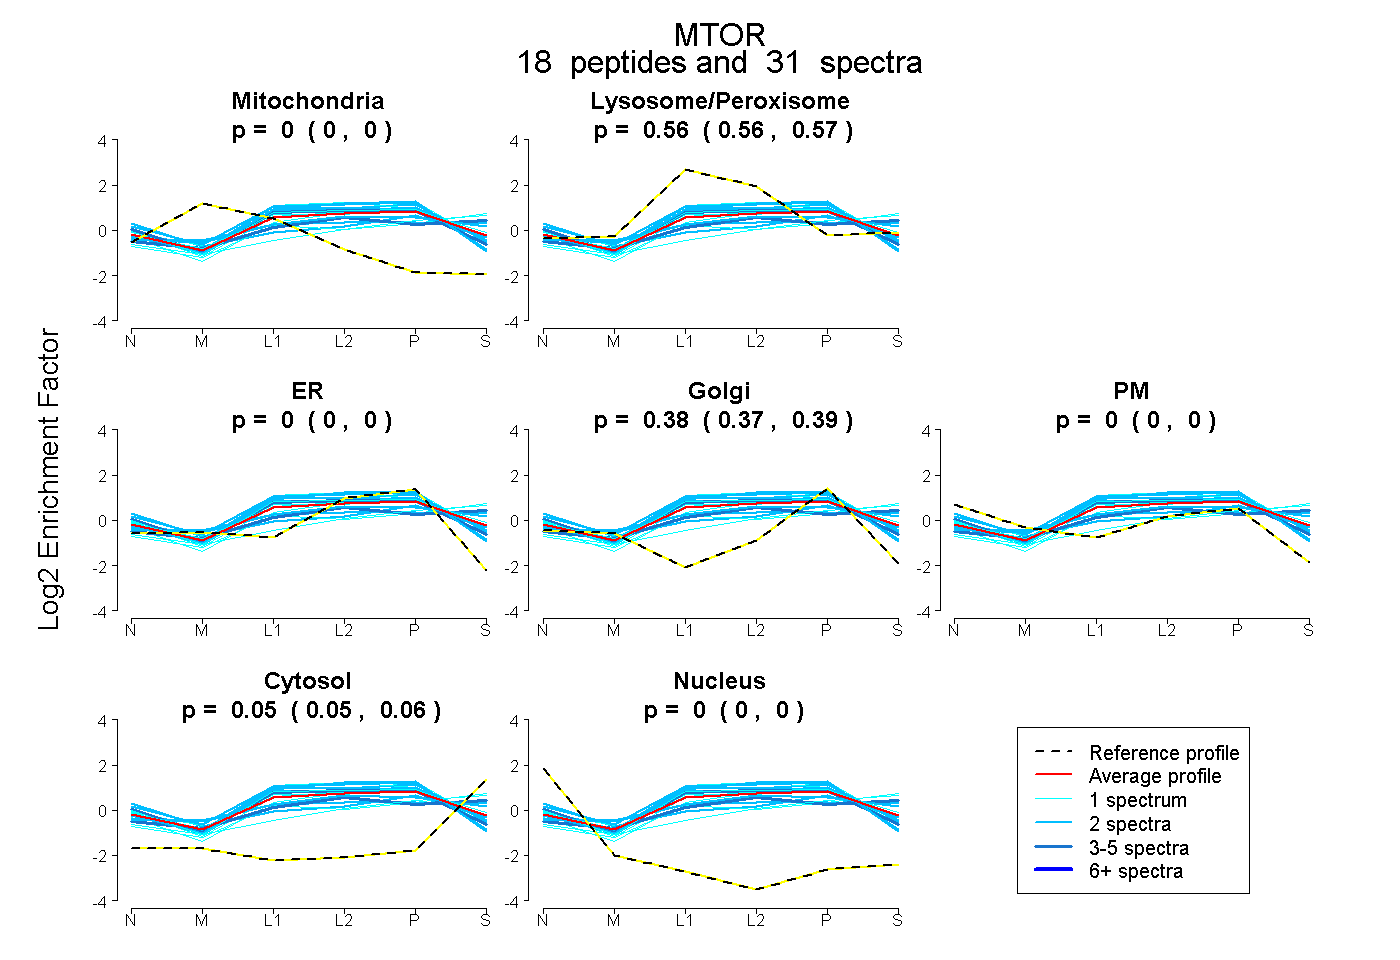 |
0.000 0.000 | 0.000 |
0.565 0.559 | 0.569 |
0.000 0.000 | 0.000 |
0.383 0.373 | 0.389 |
0.000 0.000 | 0.000 |
0.053 0.046 | 0.059 |
0.000 0.000 | 0.000 |
|||
| Plot | Lyso | Other | |||||||||||
| Expt C |
51 peptides |
169 spectra |
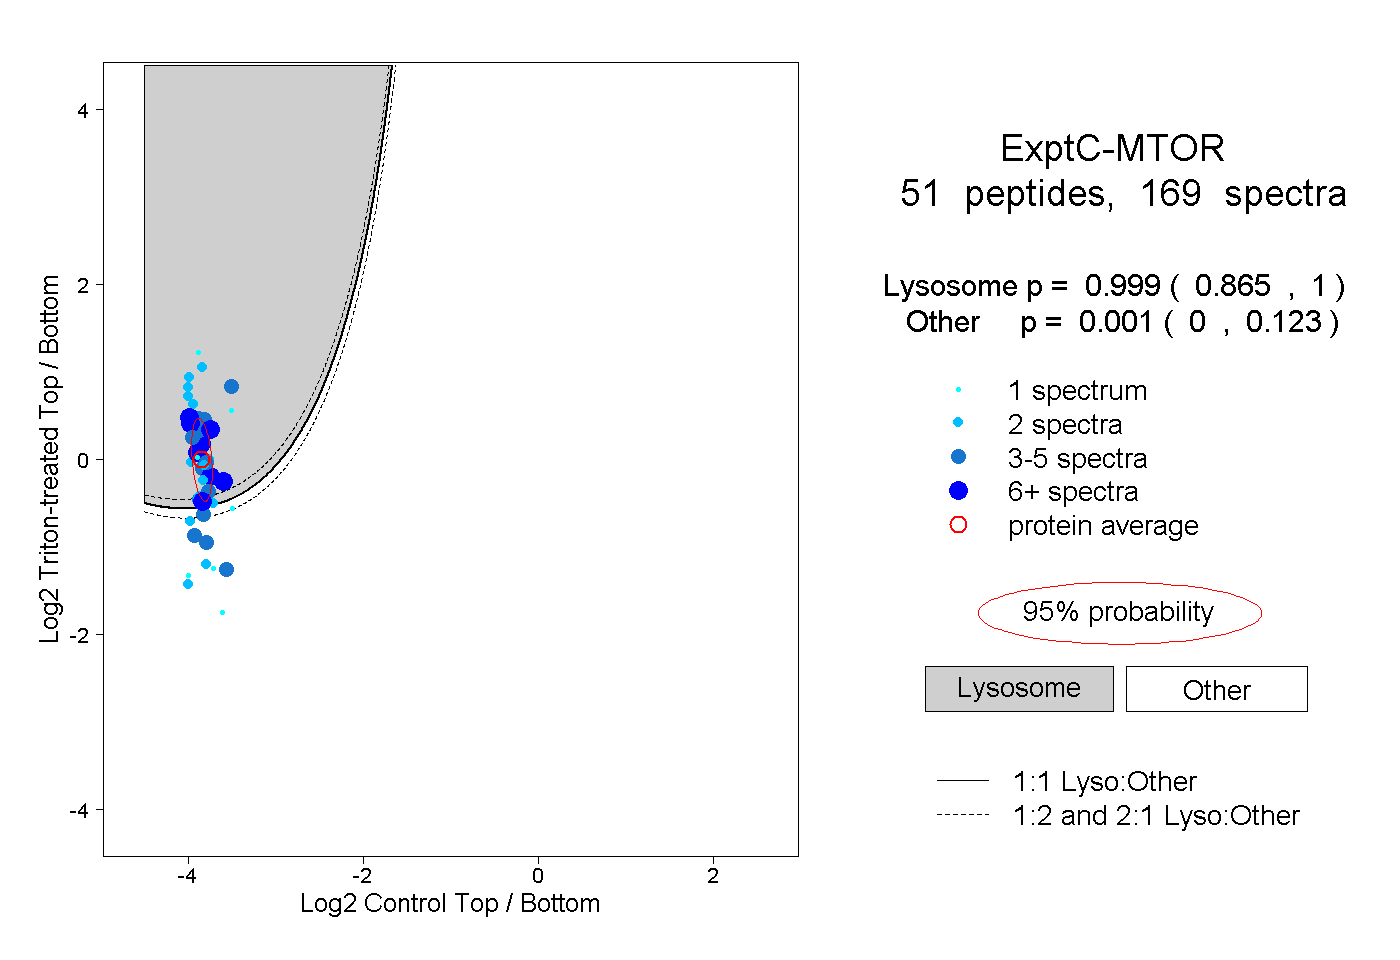 |
0.999 0.865 | 1.000 |
0.001 0.000 | 0.123 |
||||||||
| Plot | Lyso | Other | |||||||||||
| Expt D |
6 peptides |
9 spectra |
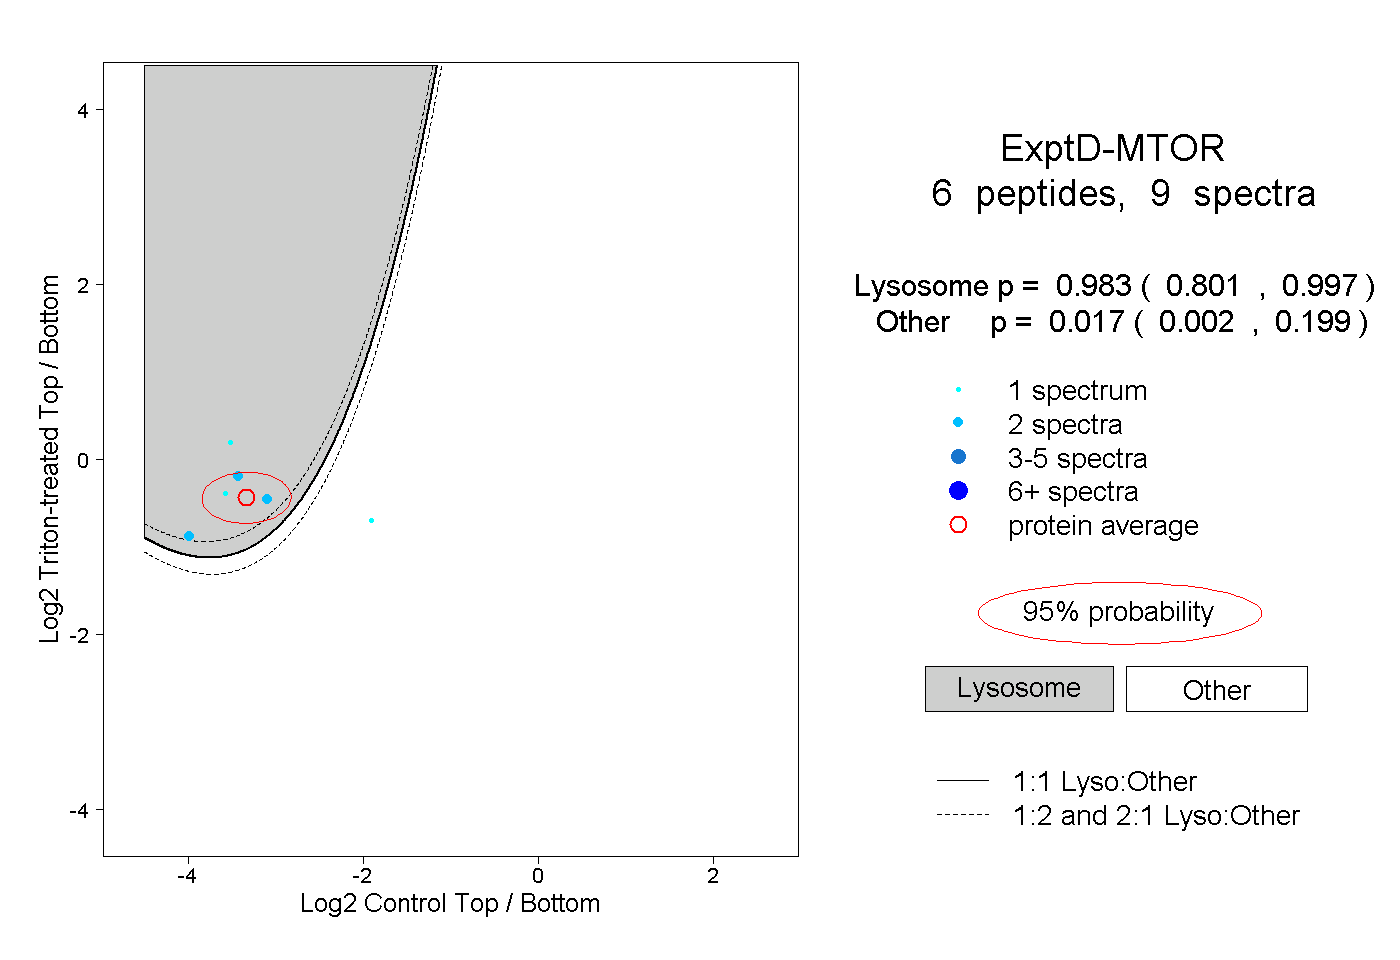 |
0.983 0.801 | 0.997 |
0.017 0.002 | 0.199 |