 5
5peptides
spectra
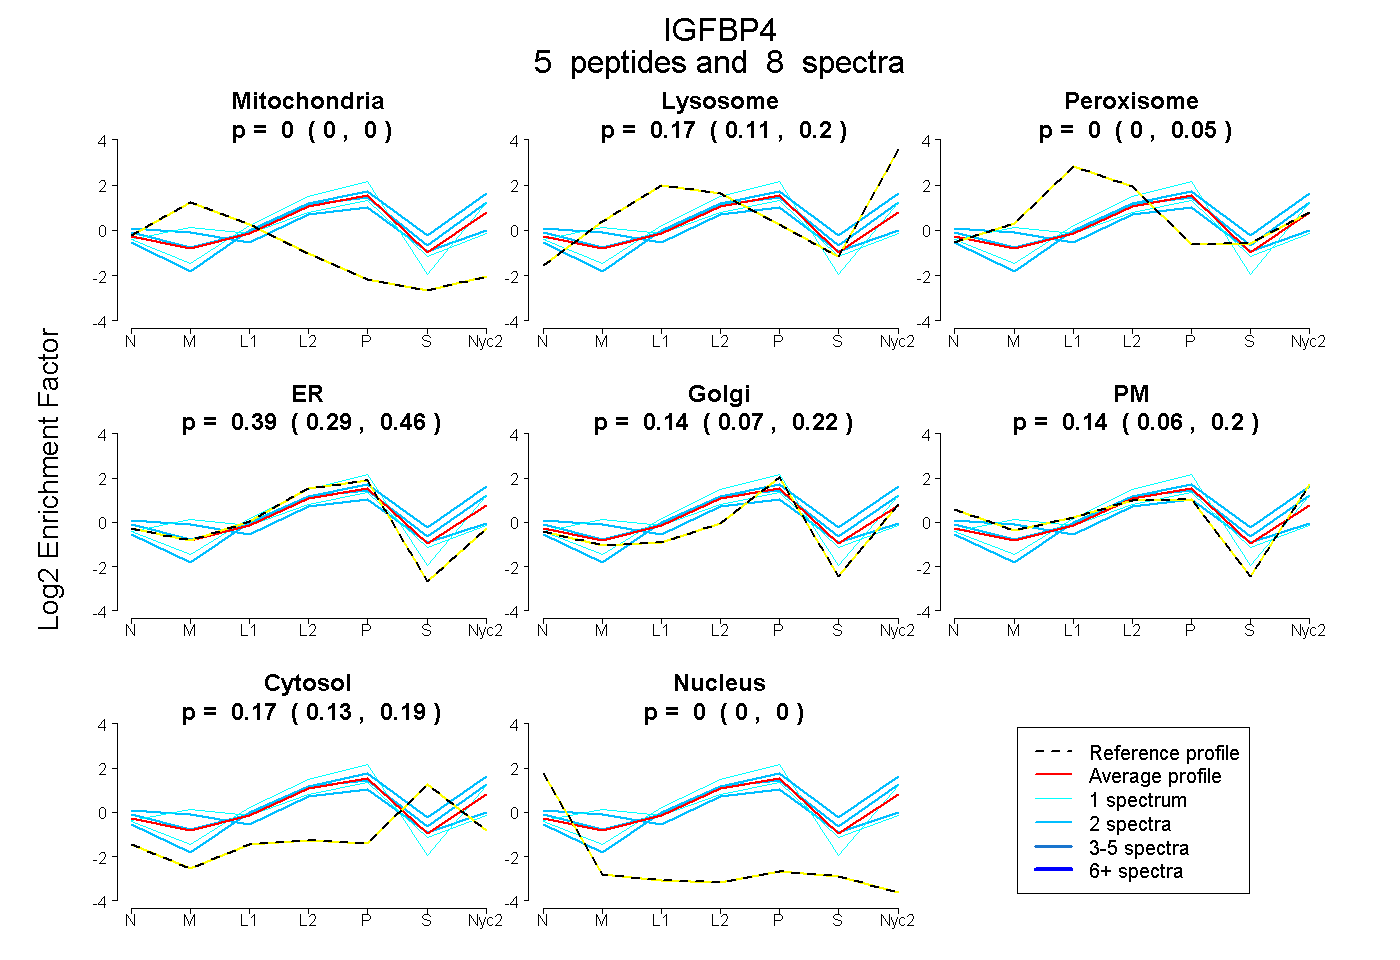
0.000 | 0.000
0.112 | 0.197
0.000 | 0.047
0.294 | 0.459
0.070 | 0.225
0.056 | 0.197
0.126 | 0.190
0.000 | 0.000
3peptides
spectra
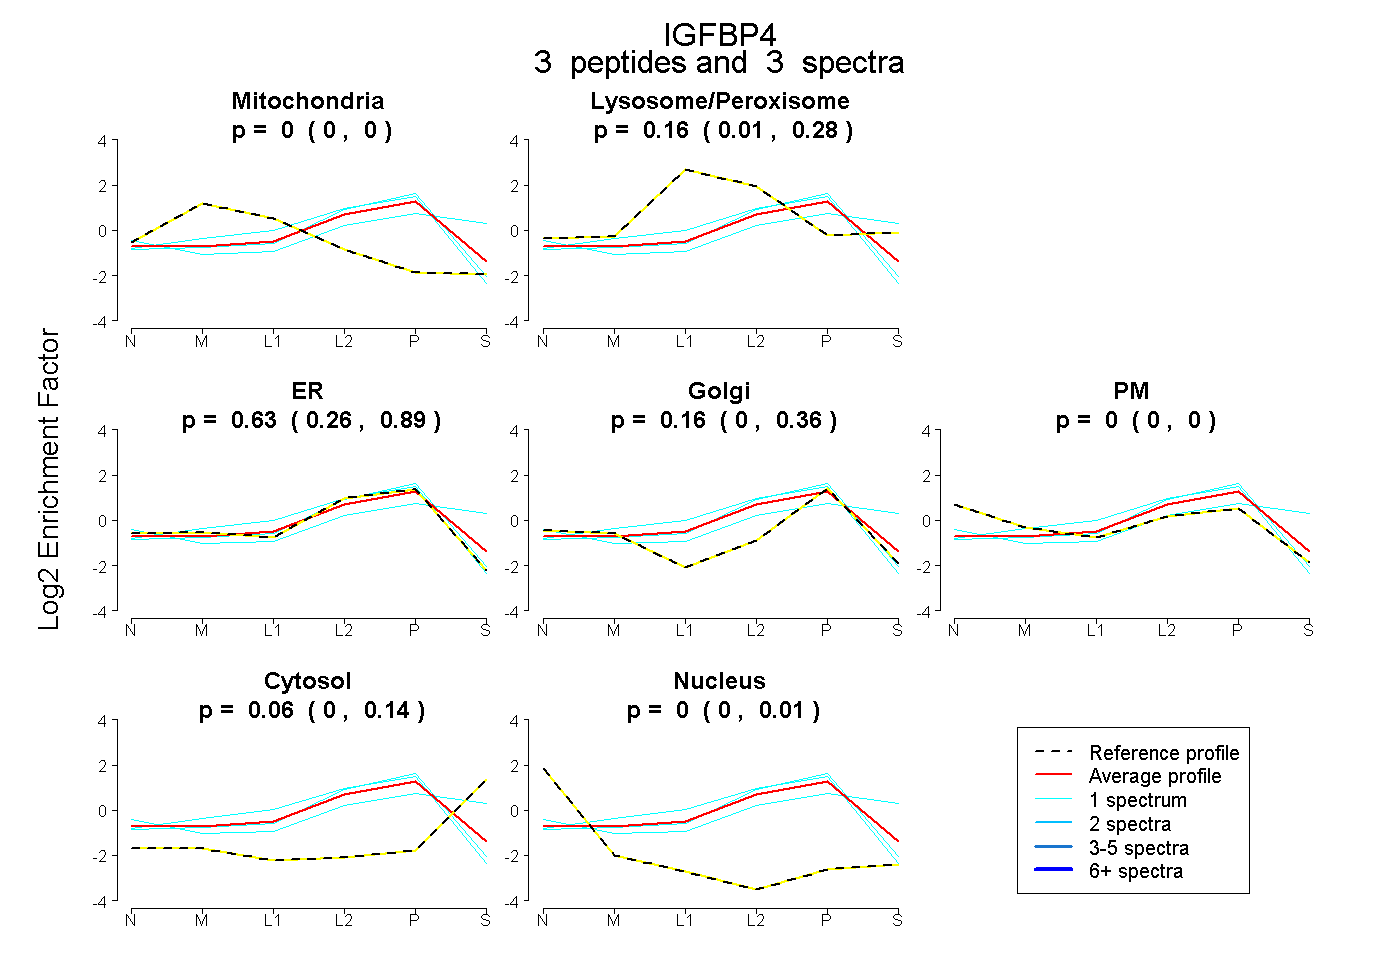
0.000 | 0.003
0.009 | 0.280
0.256 | 0.889
0.000 | 0.358
0.000 | 0.000
0.000 | 0.142
0.000 | 0.006
3peptides
spectra
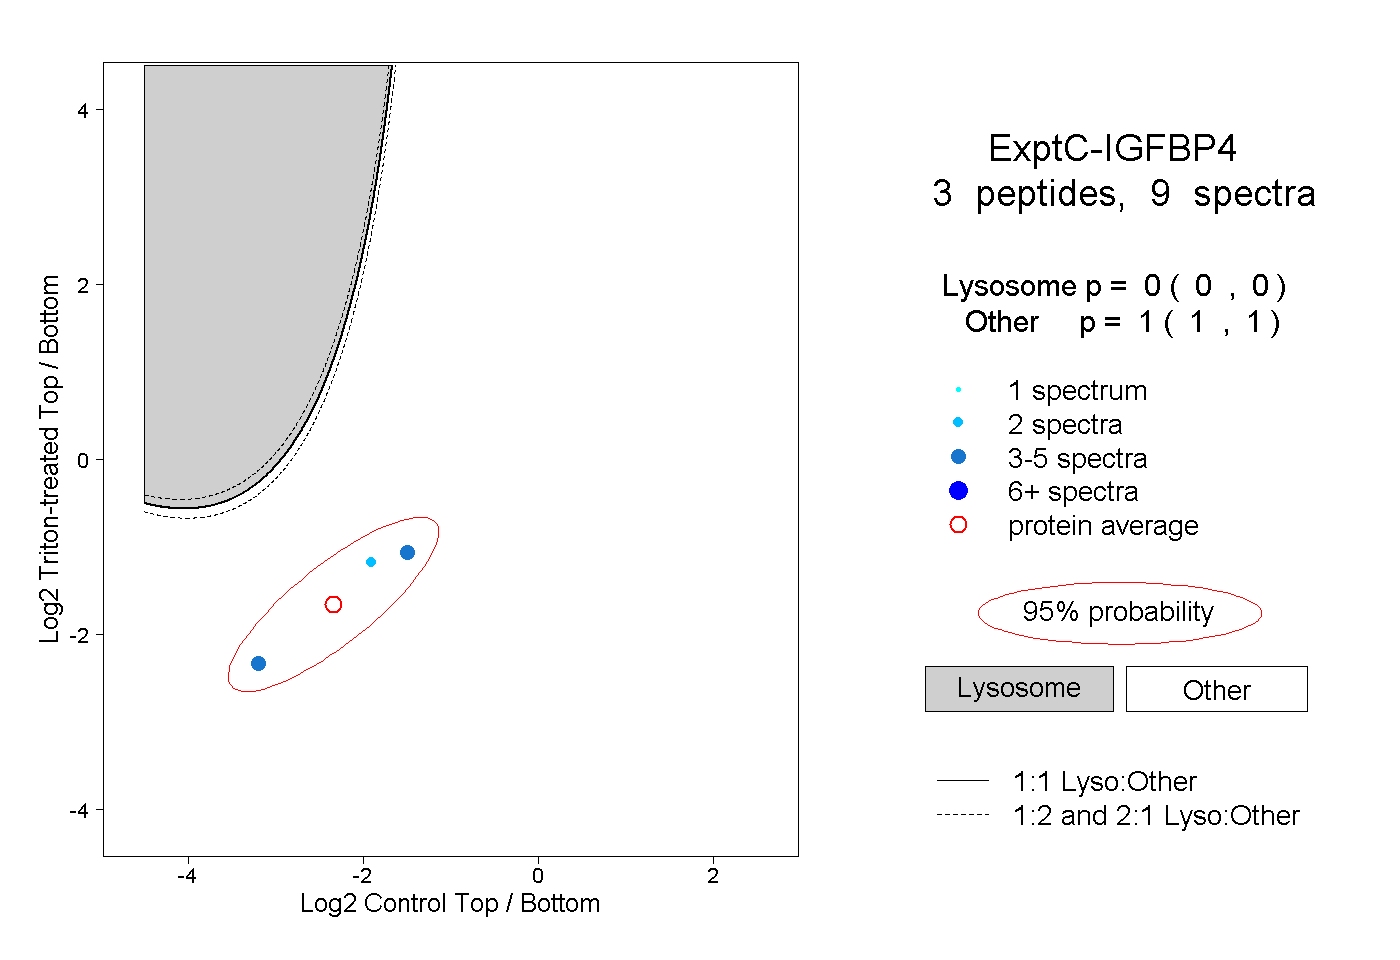
0.000 | 0.000
1.000 | 1.000
1peptide
spectra
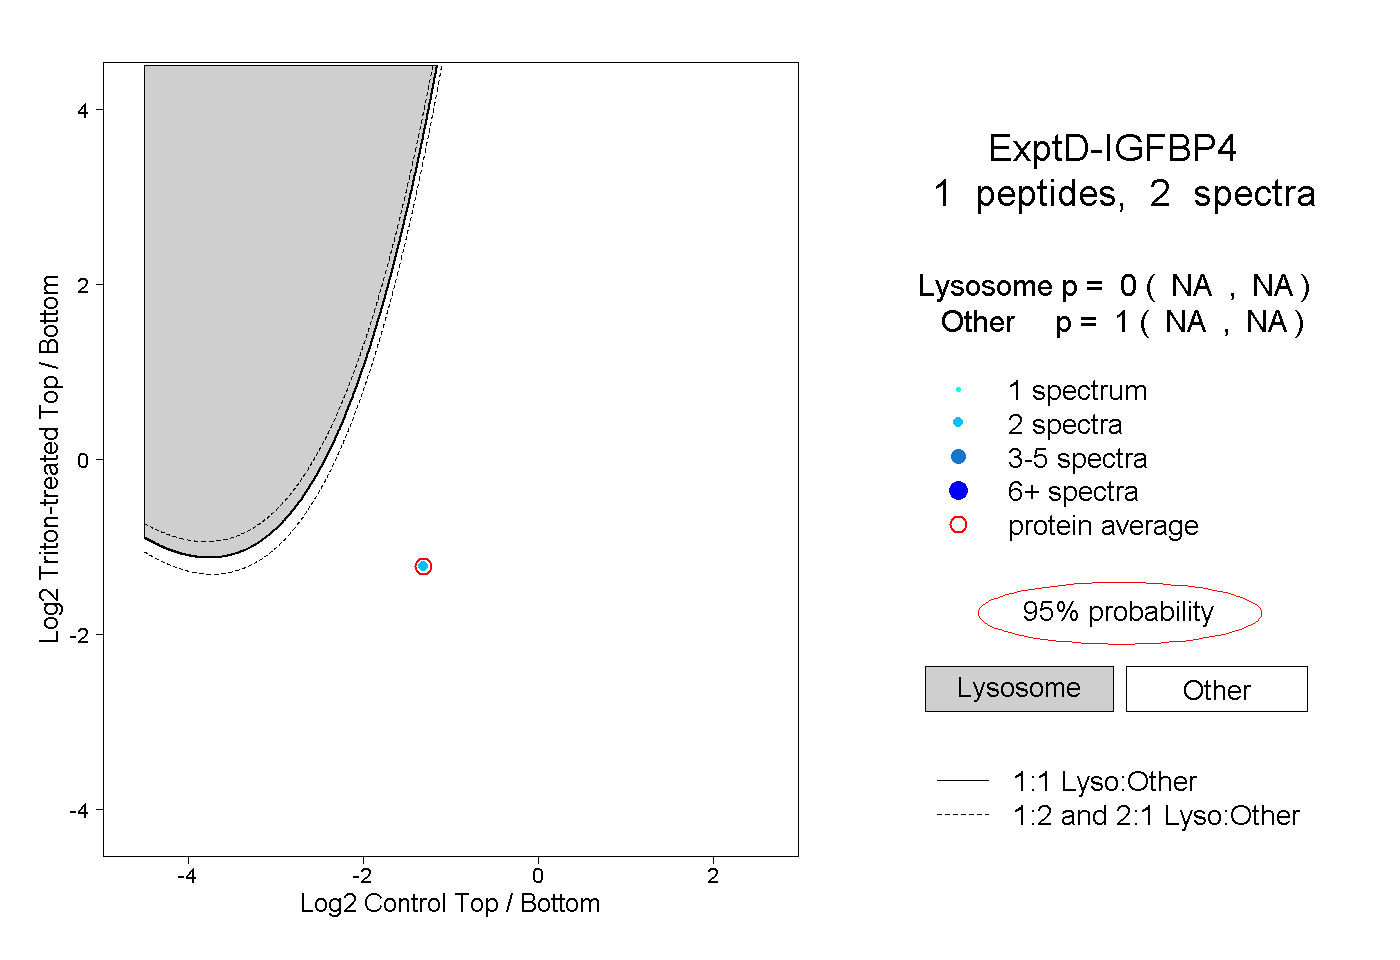
NA | NA
NA | NA