 5
5peptides
spectra
0.000 | 0.000
0.112 | 0.197
0.000 | 0.047
0.294 | 0.459
0.070 | 0.225
0.056 | 0.197
0.126 | 0.190
0.000 | 0.000
| Plot | Mito | Lyso | Perox | ER | Golgi | PM | Cytosol | Nucleus | |||||
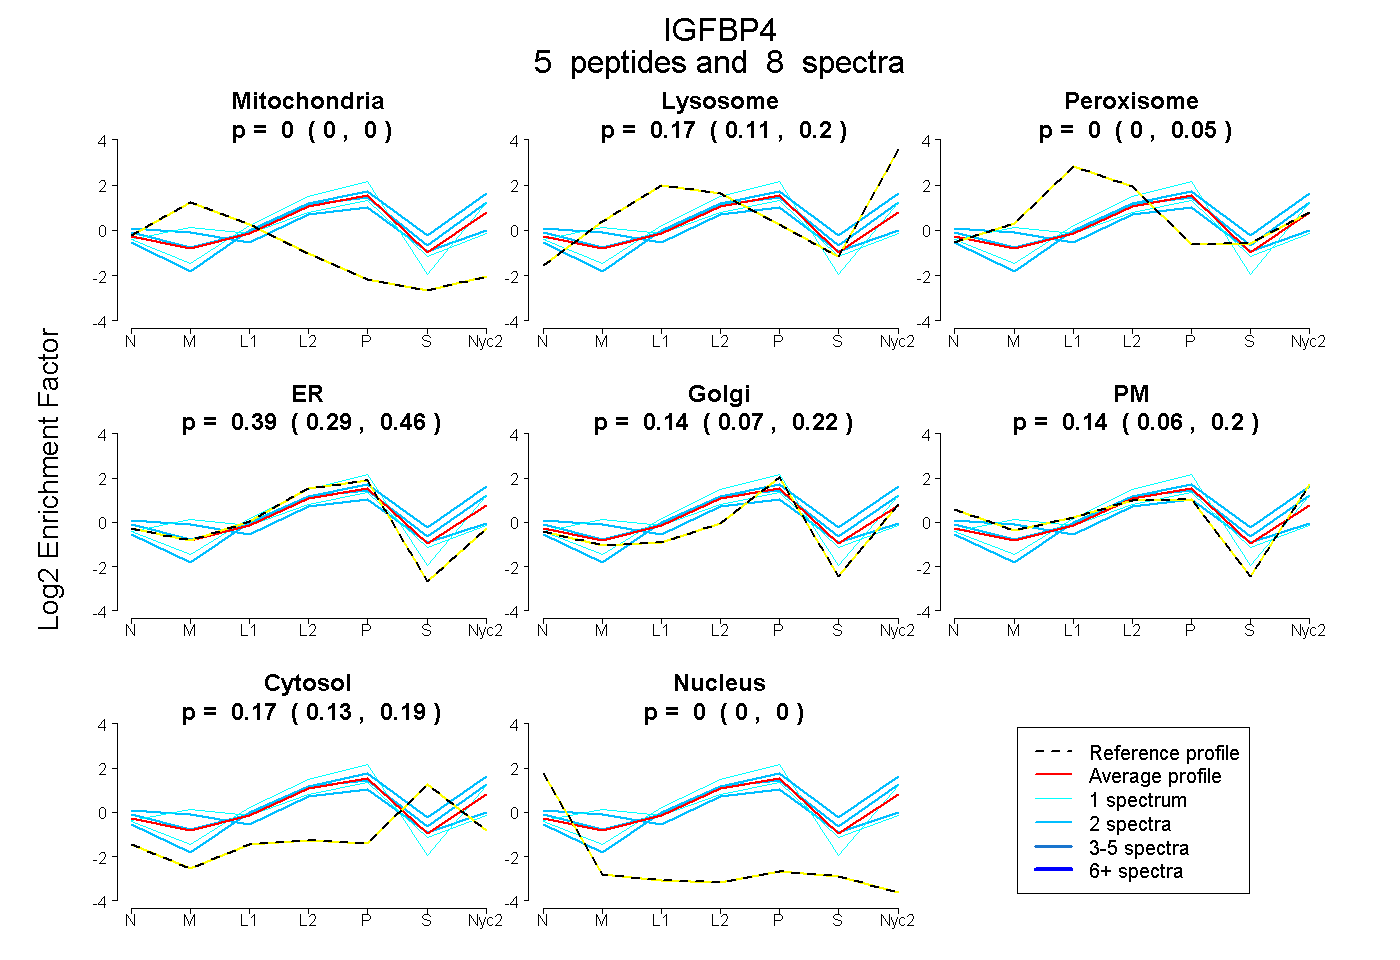
| Expt A |
5 peptides |
8 spectra |
|
0.000 0.000 | 0.000 |
0.165 0.112 | 0.197 |
0.000 0.000 | 0.047 |
0.393 0.294 | 0.459 |
0.138 0.070 | 0.225 |
0.137 0.056 | 0.197 |
0.166 0.126 | 0.190 |
0.000 0.000 | 0.000 |
| 2 spectra, GVEKPLR | 0.000 | 0.316 | 0.000 | 0.162 | 0.317 | 0.000 | 0.205 | 0.000 | ||
| 1 spectrum, QCHPALDGQR | 0.066 | 0.000 | 0.193 | 0.371 | 0.274 | 0.000 | 0.096 | 0.000 | ||
| 2 spectra, EEPRPVPQGSCQSELHR | 0.053 | 0.000 | 0.037 | 0.377 | 0.009 | 0.301 | 0.223 | 0.000 | ||
| 1 spectrum, GELDCHQLADSLQE | 0.000 | 0.202 | 0.000 | 0.488 | 0.309 | 0.000 | 0.000 | 0.000 | ||
| 2 spectra, CRPPVGCEELVR | 0.000 | 0.201 | 0.000 | 0.238 | 0.089 | 0.295 | 0.177 | 0.000 |
| Plot | Mito | Lyso or Perox | ER | Golgi | PM | Cytosol | Nucleus | ||||||
| Expt B |
3 peptides |
3 spectra |
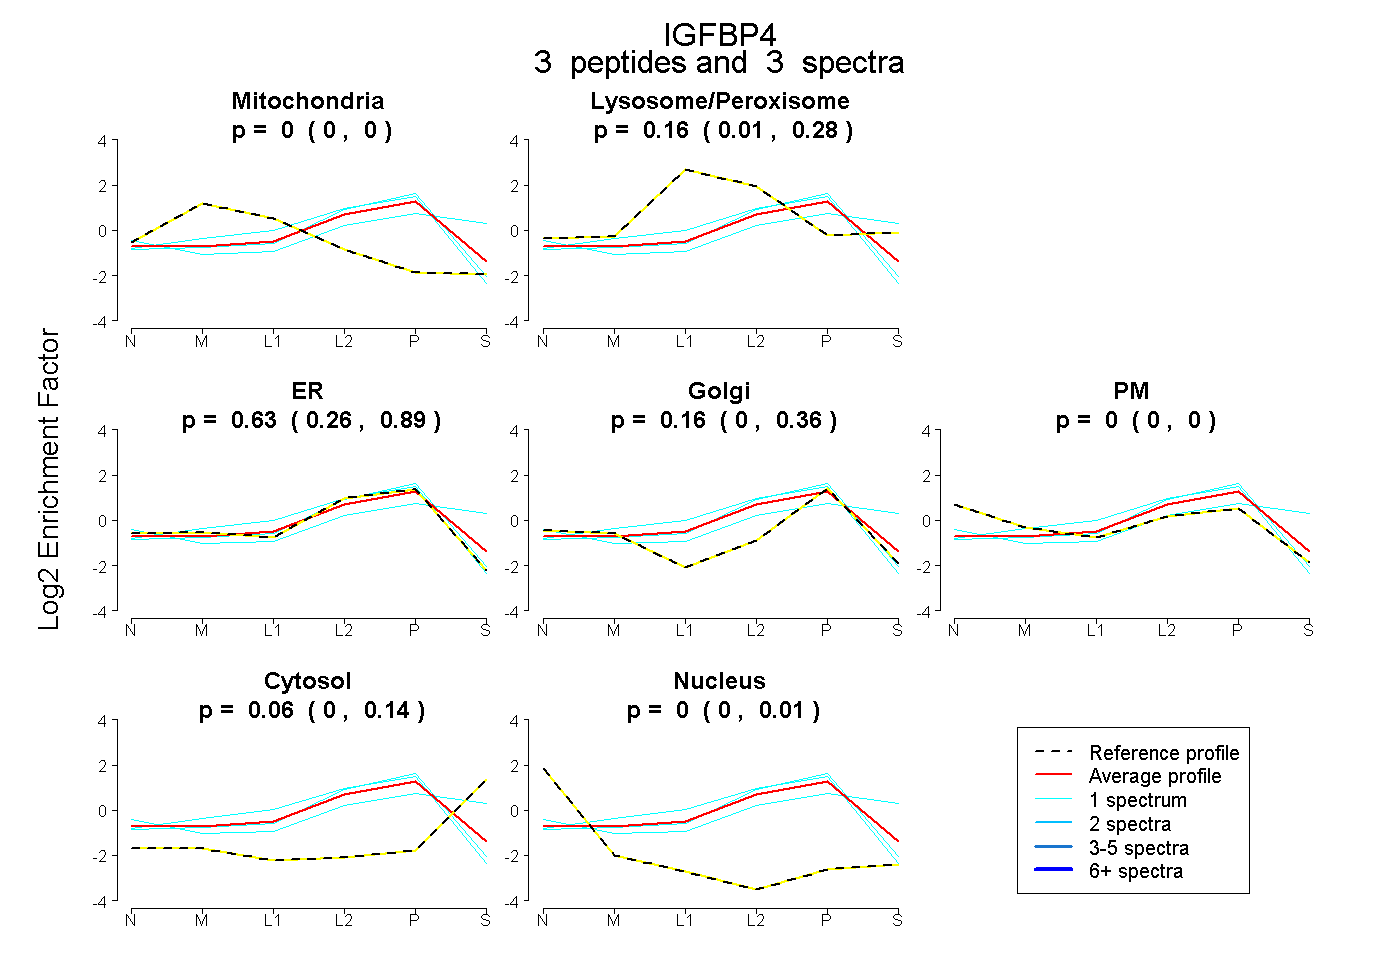 |
0.000 0.000 | 0.003 |
0.155 0.009 | 0.280 |
0.628 0.256 | 0.889 |
0.158 0.000 | 0.358 |
0.000 0.000 | 0.000 |
0.059 0.000 | 0.142 |
0.000 0.000 | 0.006 |
|||
| Plot | Lyso | Other | |||||||||||
| Expt C |
3 peptides |
9 spectra |
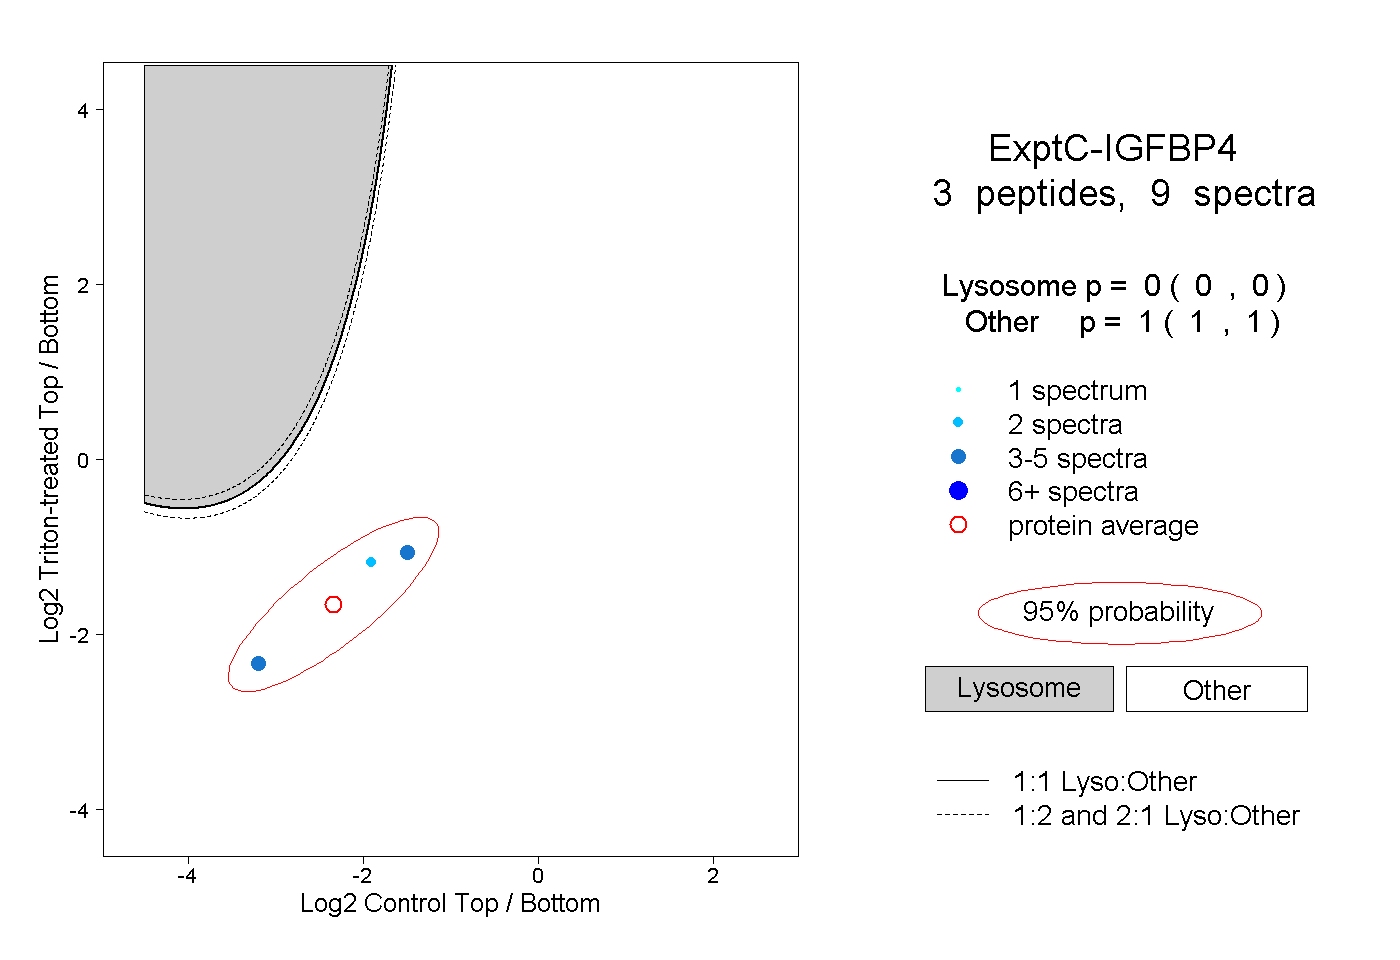 |
0.000 0.000 | 0.000 |
1.000 1.000 | 1.000 |
||||||||
| Plot | Lyso | Other | |||||||||||
| Expt D |
1 peptide |
2 spectra |
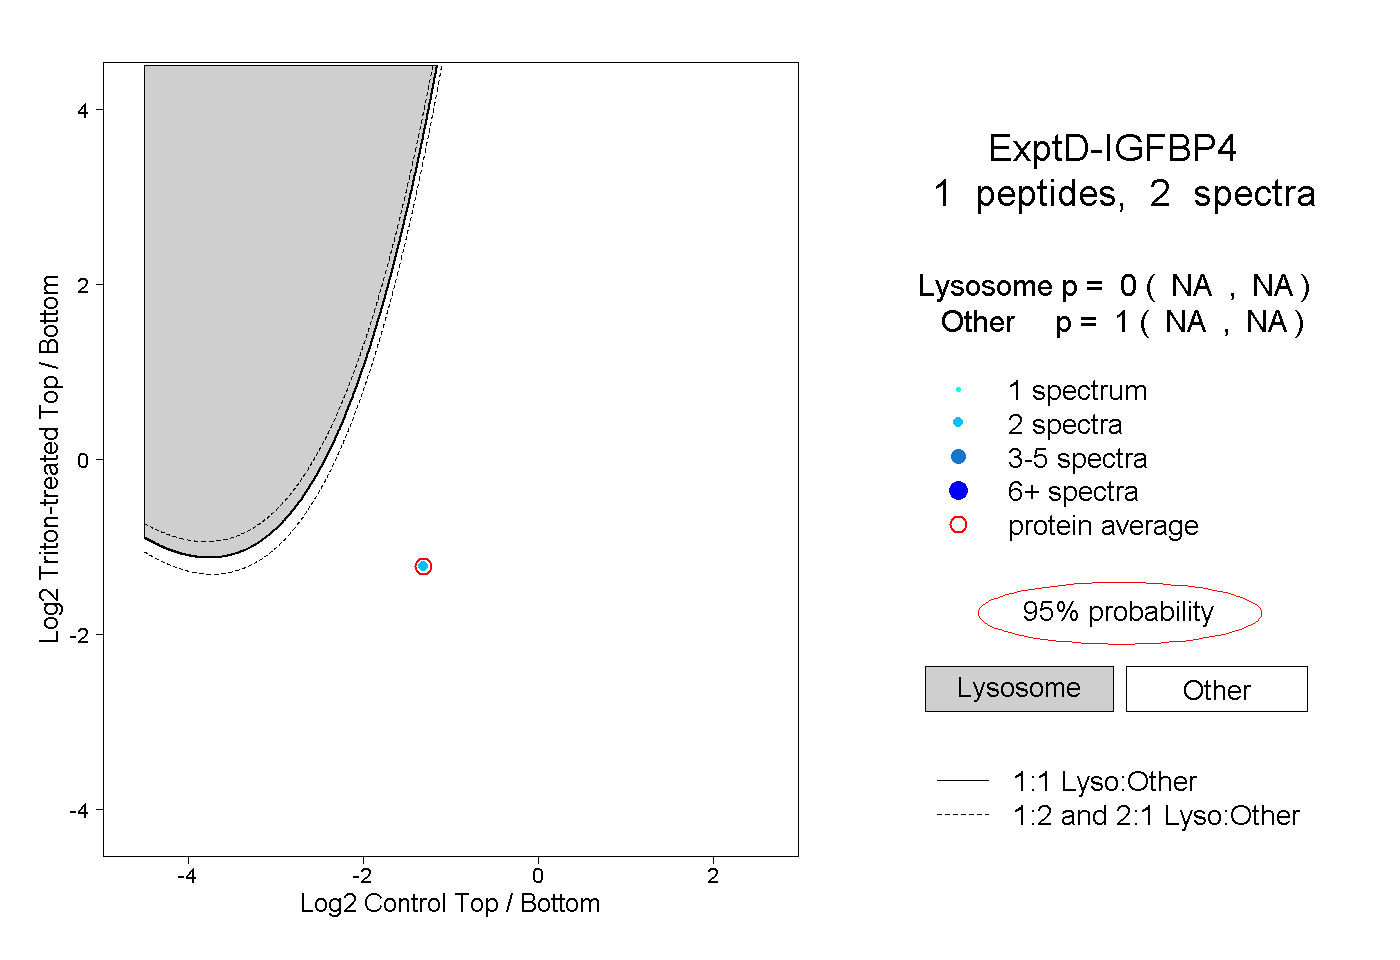 |
0.000 NA | NA |
1.000 NA | NA |