 13
13peptides
spectra
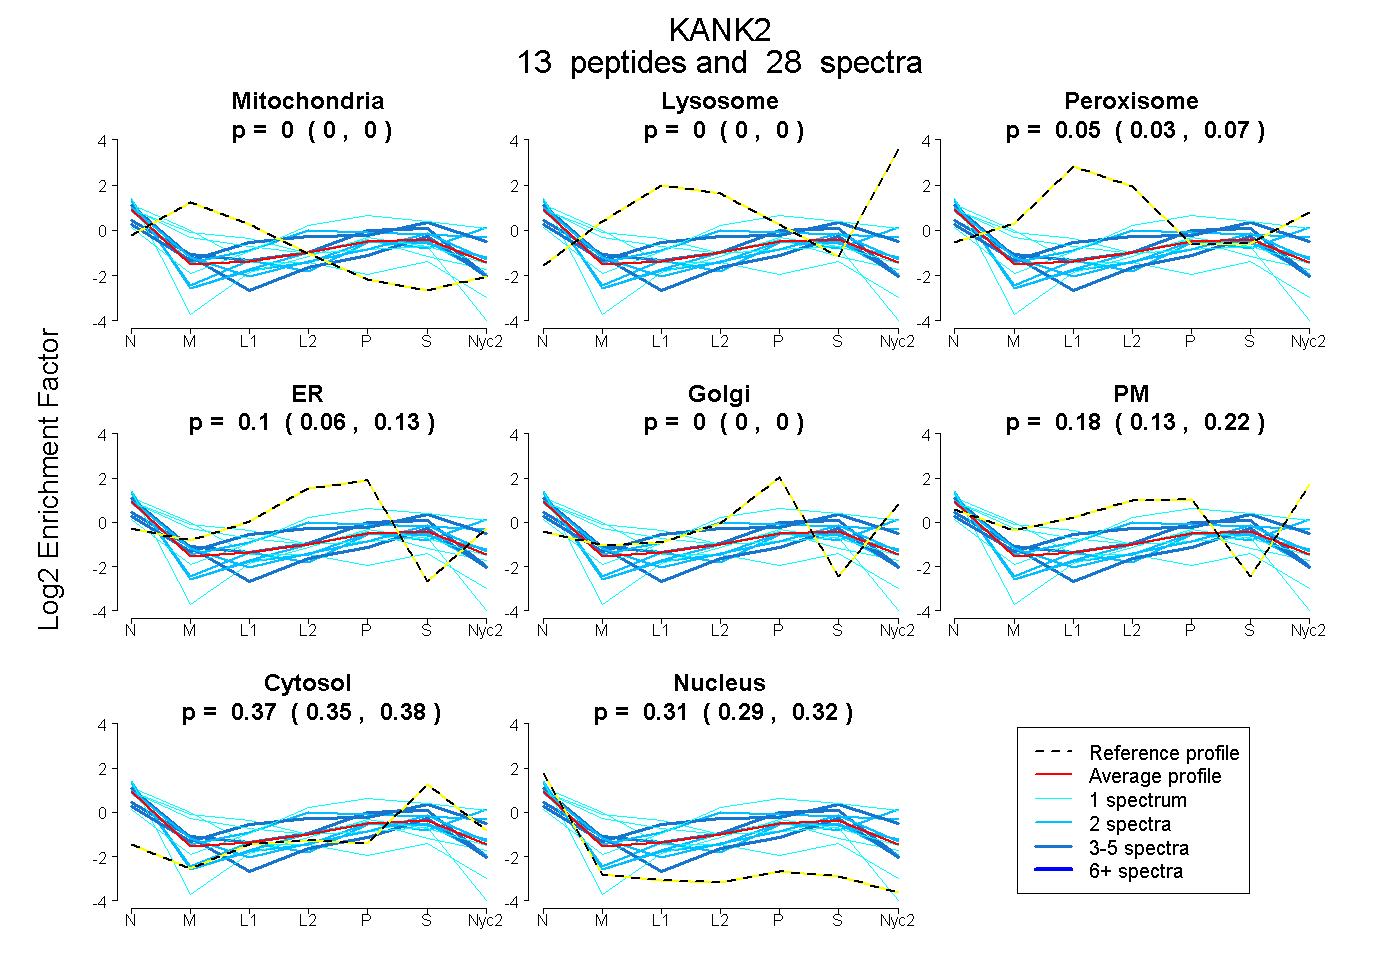
0.000 | 0.000
0.000 | 0.000
0.029 | 0.069
0.063 | 0.127
0.000 | 0.000
0.130 | 0.216
0.353 | 0.382
0.293 | 0.315
1peptide
spectra
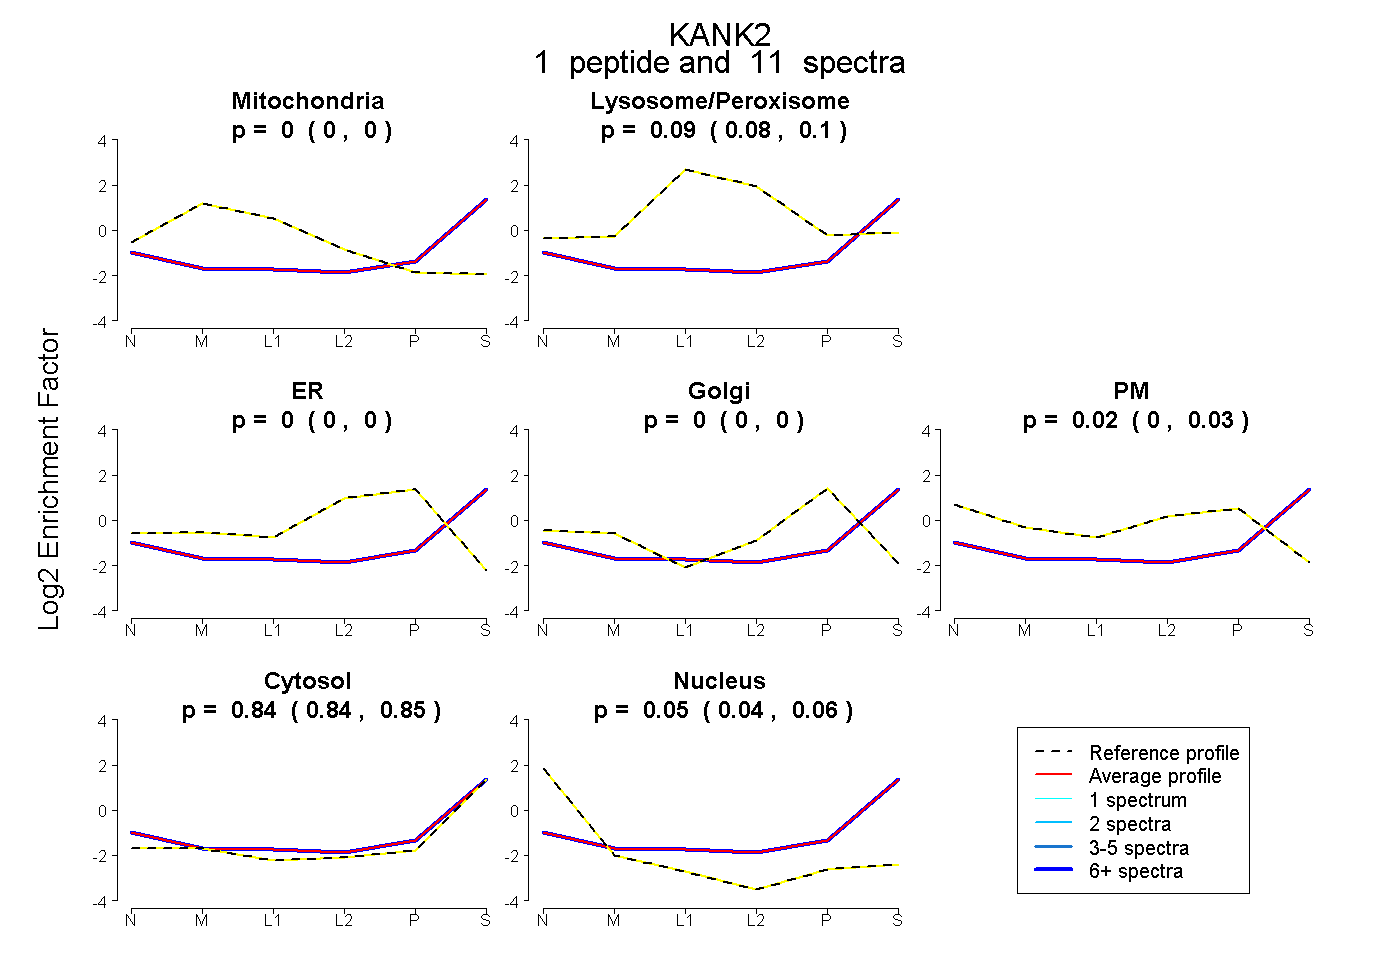
0.000 | 0.000
0.075 | 0.101
0.000 | 0.000
0.000 | 0.000
0.000 | 0.033
0.836 | 0.847
0.041 | 0.059
4peptides
spectra
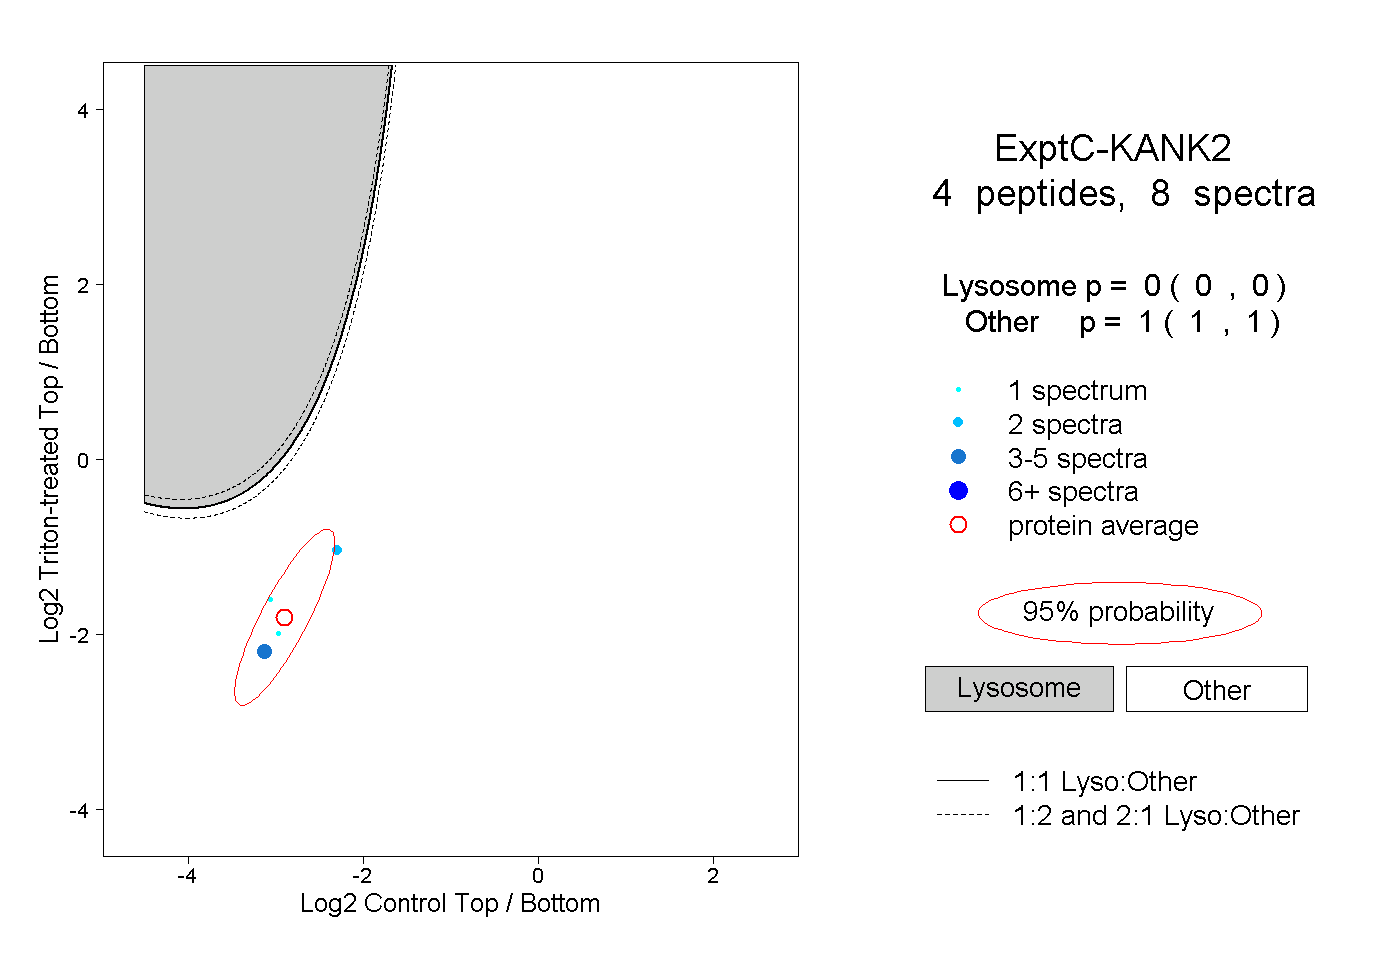
0.000 | 0.000
1.000 | 1.000