 13
13peptides
spectra
0.000 | 0.000
0.000 | 0.000
0.029 | 0.069
0.063 | 0.127
0.000 | 0.000
0.130 | 0.216
0.353 | 0.382
0.293 | 0.315
| Plot | Mito | Lyso | Perox | ER | Golgi | PM | Cytosol | Nucleus | |||||
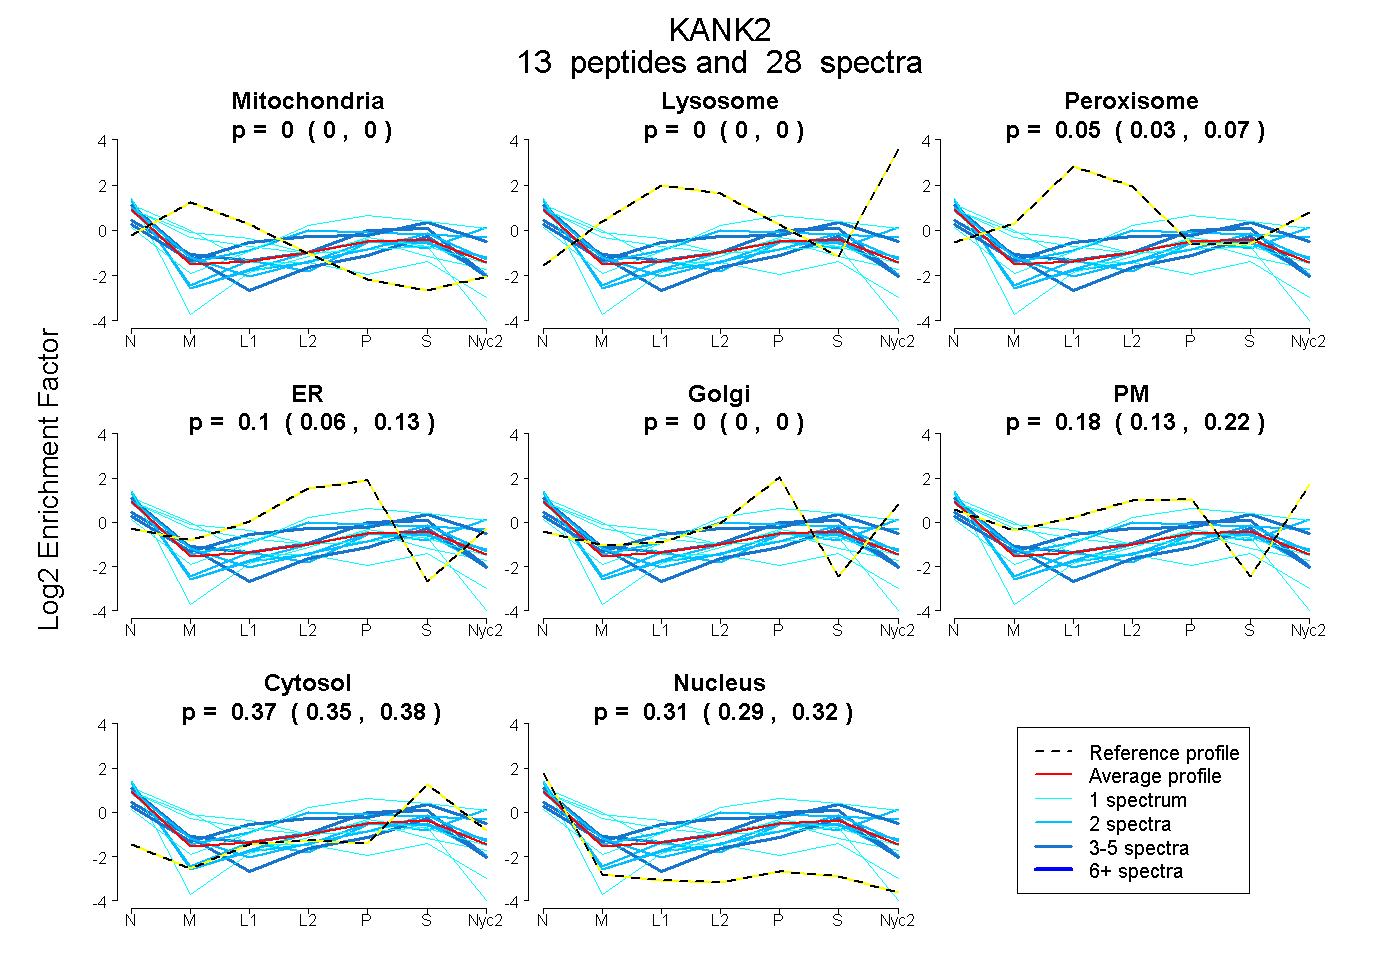
| Expt A |
13 peptides |
28 spectra |
|
0.000 0.000 | 0.000 |
0.000 0.000 | 0.000 |
0.052 0.029 | 0.069 |
0.098 0.063 | 0.127 |
0.000 0.000 | 0.000 |
0.177 0.130 | 0.216 |
0.368 0.353 | 0.382 |
0.305 0.293 | 0.315 |
| 2 spectra, YLENPNALTER | 0.014 | 0.000 | 0.000 | 0.000 | 0.000 | 0.240 | 0.428 | 0.318 | ||
| 1 spectrum, DLGIPDGEAALVAK | 0.521 | 0.000 | 0.007 | 0.000 | 0.000 | 0.000 | 0.120 | 0.351 | ||
| 5 spectra, QLEEQVK | 0.000 | 0.000 | 0.147 | 0.056 | 0.000 | 0.216 | 0.509 | 0.073 | ||
| 4 spectra, HLVTFR | 0.052 | 0.000 | 0.000 | 0.000 | 0.018 | 0.112 | 0.396 | 0.421 | ||
| 2 spectra, ALATSAENTLVFR | 0.000 | 0.000 | 0.000 | 0.000 | 0.000 | 0.400 | 0.325 | 0.275 | ||
| 1 spectrum, LIPVLQVK | 0.000 | 0.000 | 0.000 | 0.106 | 0.121 | 0.026 | 0.354 | 0.394 | ||
| 4 spectra, ASQAGQTALMLAVSHGR | 0.073 | 0.000 | 0.000 | 0.279 | 0.000 | 0.000 | 0.462 | 0.186 | ||
| 1 spectrum, ALQELR | 0.291 | 0.000 | 0.179 | 0.068 | 0.138 | 0.000 | 0.080 | 0.244 | ||
| 2 spectra, GFYPQYGALETR | 0.000 | 0.000 | 0.001 | 0.110 | 0.000 | 0.101 | 0.375 | 0.414 | ||
| 2 spectra, LDLDFLK | 0.000 | 0.000 | 0.000 | 0.000 | 0.058 | 0.210 | 0.363 | 0.369 | ||
| 1 spectrum, VAPGPDPEEEIR | 0.420 | 0.000 | 0.000 | 0.114 | 0.000 | 0.000 | 0.175 | 0.290 | ||
| 2 spectra, EVPADPDVHQR | 0.000 | 0.000 | 0.040 | 0.010 | 0.000 | 0.428 | 0.400 | 0.121 | ||
| 1 spectrum, VAVLETQLK | 0.000 | 0.000 | 0.000 | 0.169 | 0.001 | 0.294 | 0.536 | 0.000 |
| Plot | Mito | Lyso or Perox | ER | Golgi | PM | Cytosol | Nucleus | ||||||
| Expt B |
1 peptide |
11 spectra |
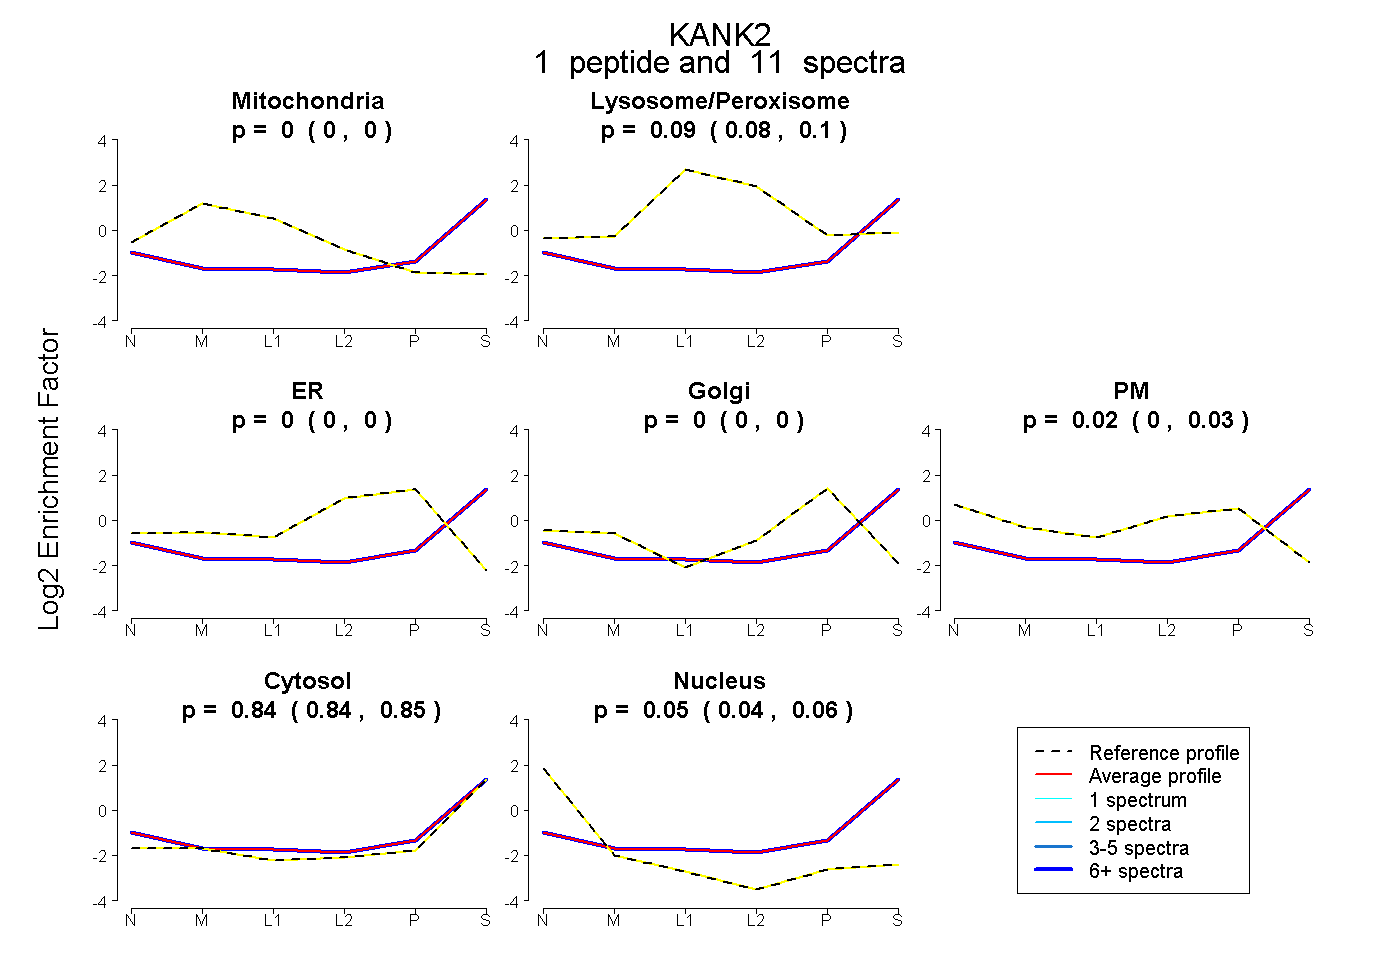 |
0.000 0.000 | 0.000 |
0.089 0.075 | 0.101 |
0.000 0.000 | 0.000 |
0.000 0.000 | 0.000 |
0.018 0.000 | 0.033 |
0.842 0.836 | 0.847 |
0.051 0.041 | 0.059 |
|||
| Plot | Lyso | Other | |||||||||||
| Expt C |
4 peptides |
8 spectra |
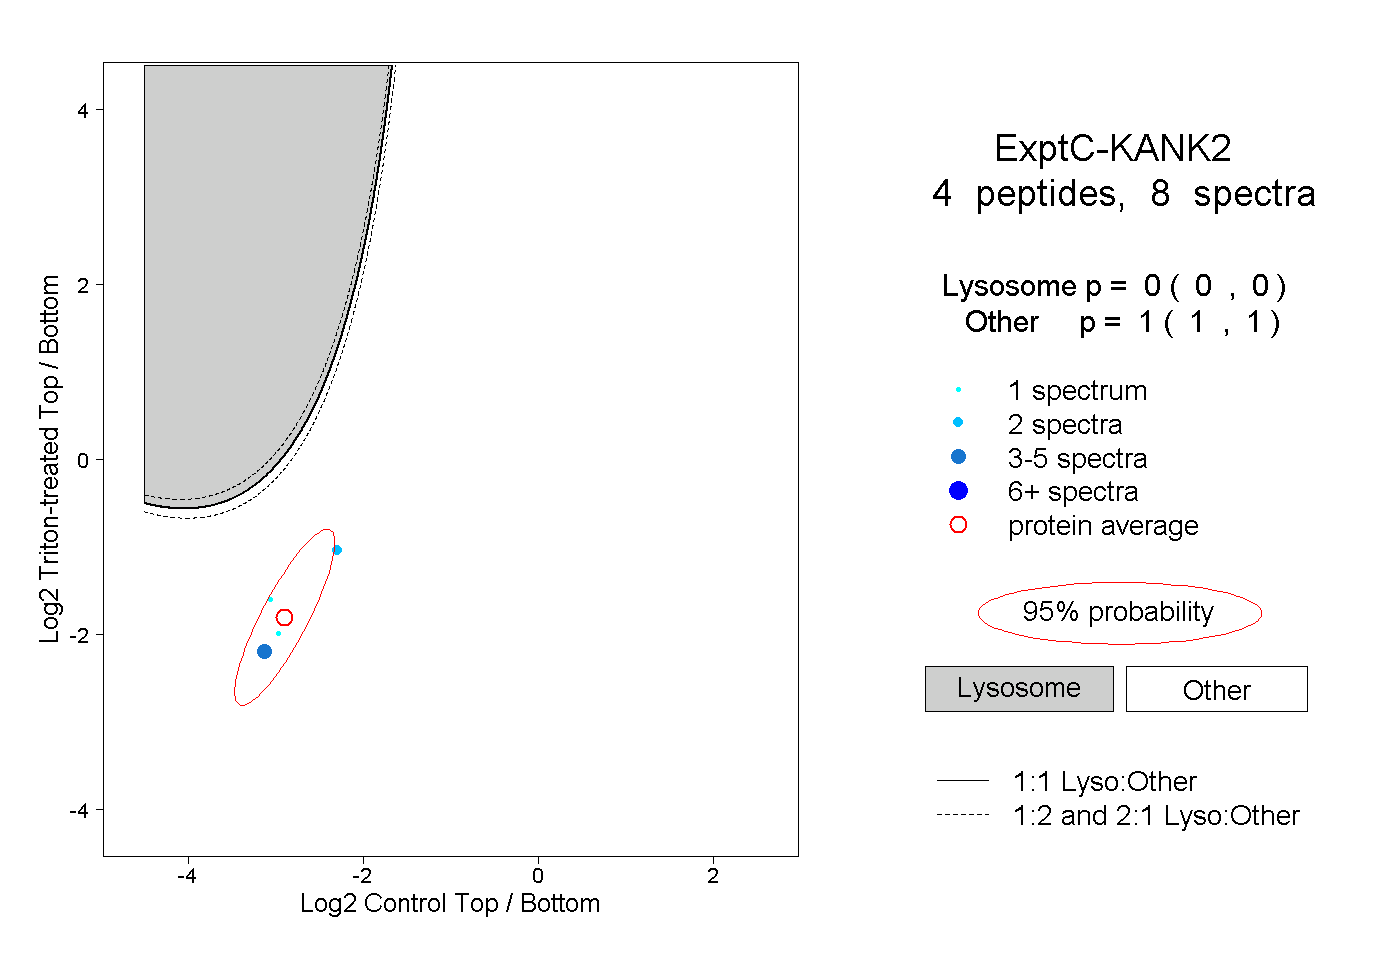 |
0.000 0.000 | 0.000 |
1.000 1.000 | 1.000 |