 7
7peptides
spectra
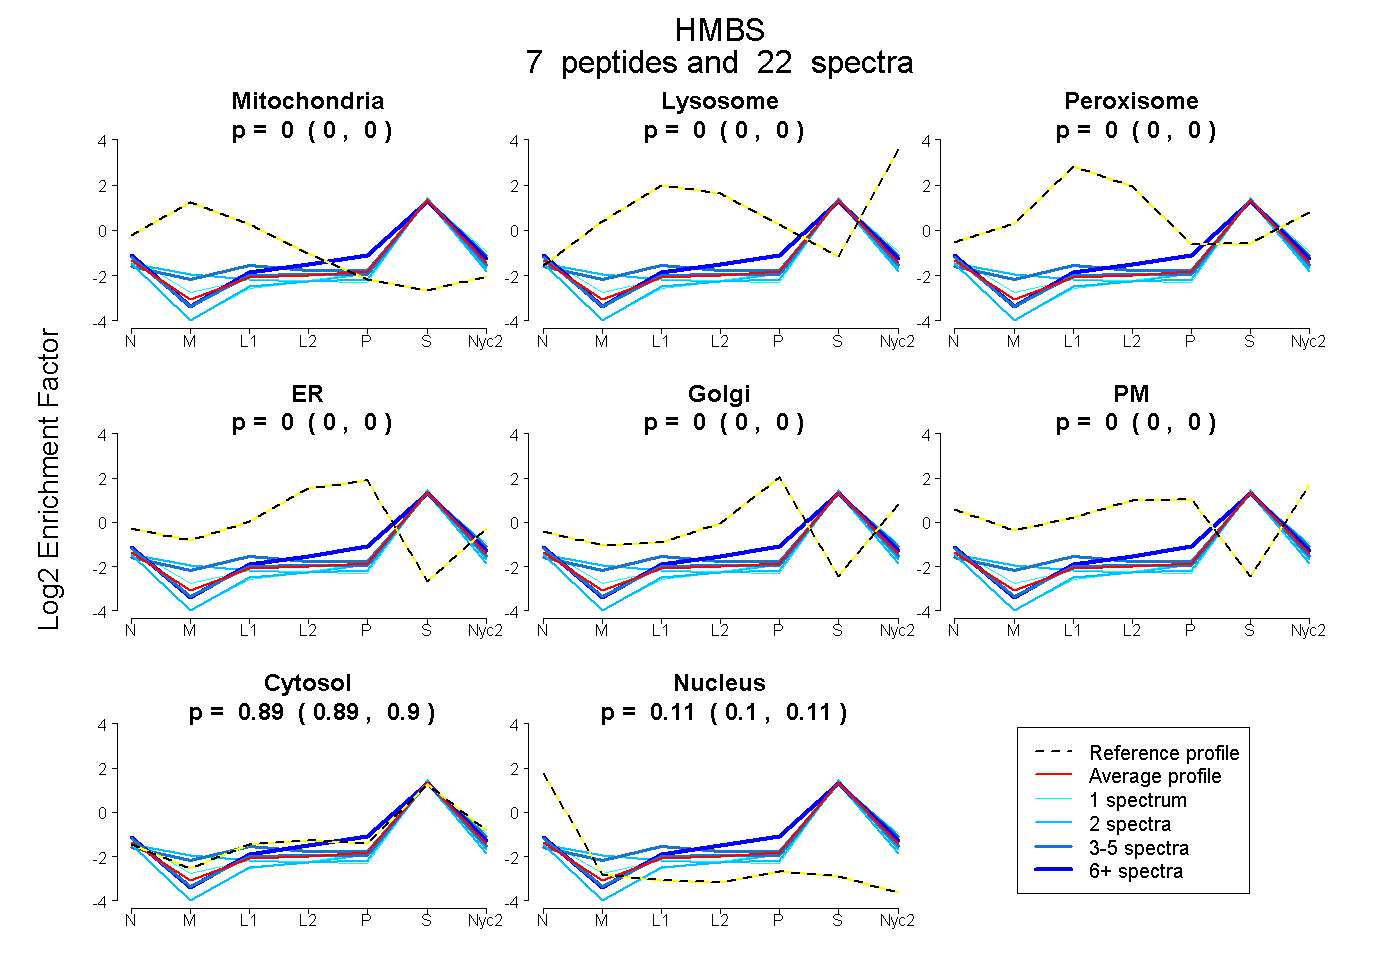
0.000 | 0.000
0.000 | 0.000
0.000 | 0.000
0.000 | 0.000
0.000 | 0.000
0.000 | 0.000
0.886 | 0.896
0.103 | 0.113
3peptides
spectra
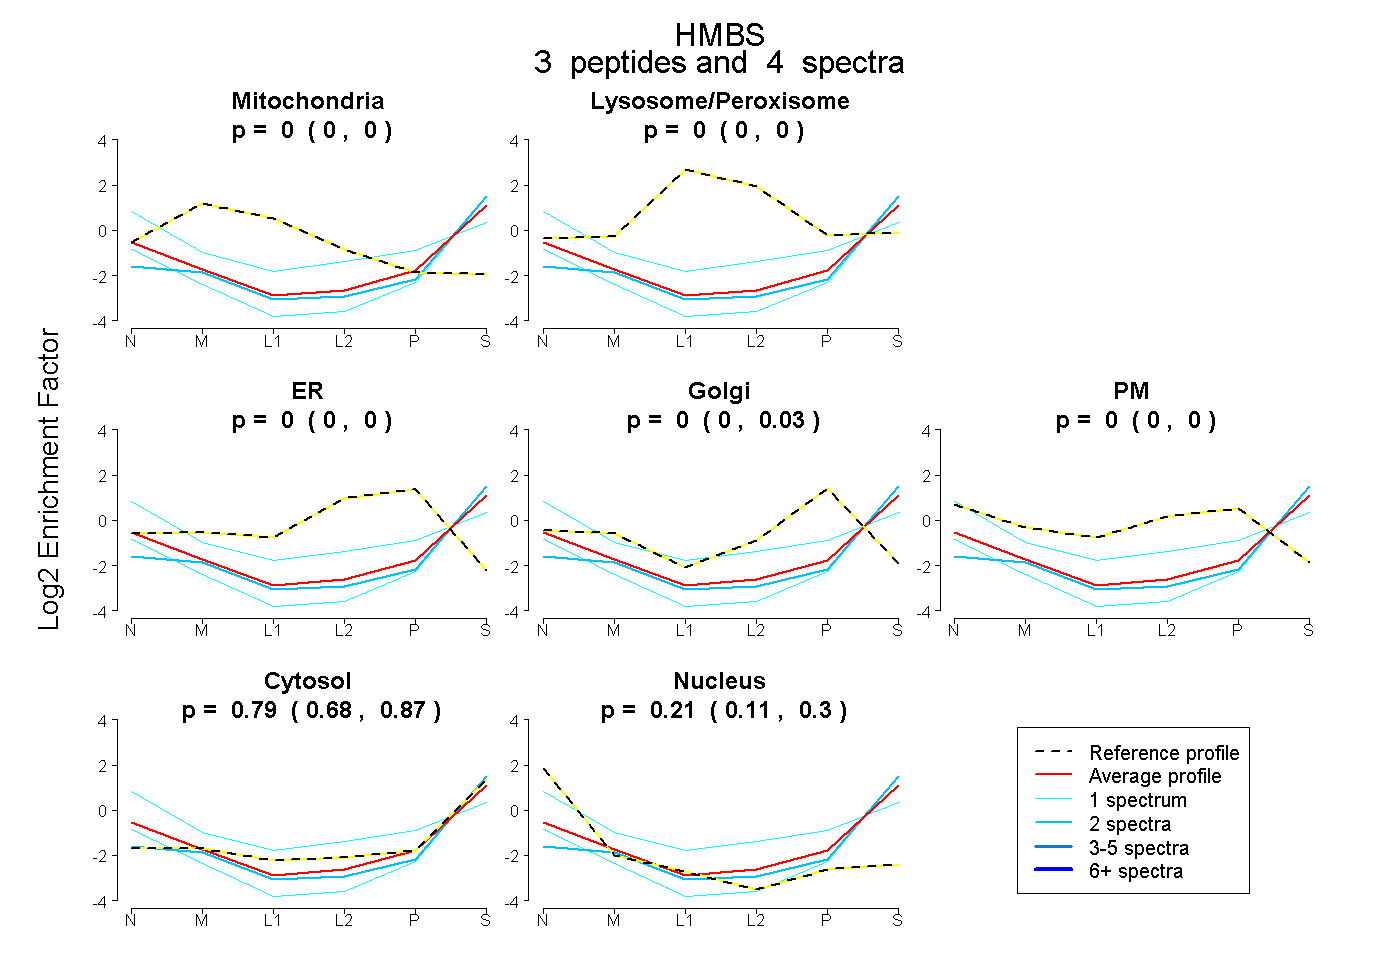
0.000 | 0.000
0.000 | 0.000
0.000 | 0.000
0.000 | 0.026
0.000 | 0.003
0.684 | 0.870
0.109 | 0.297
4peptides
spectra
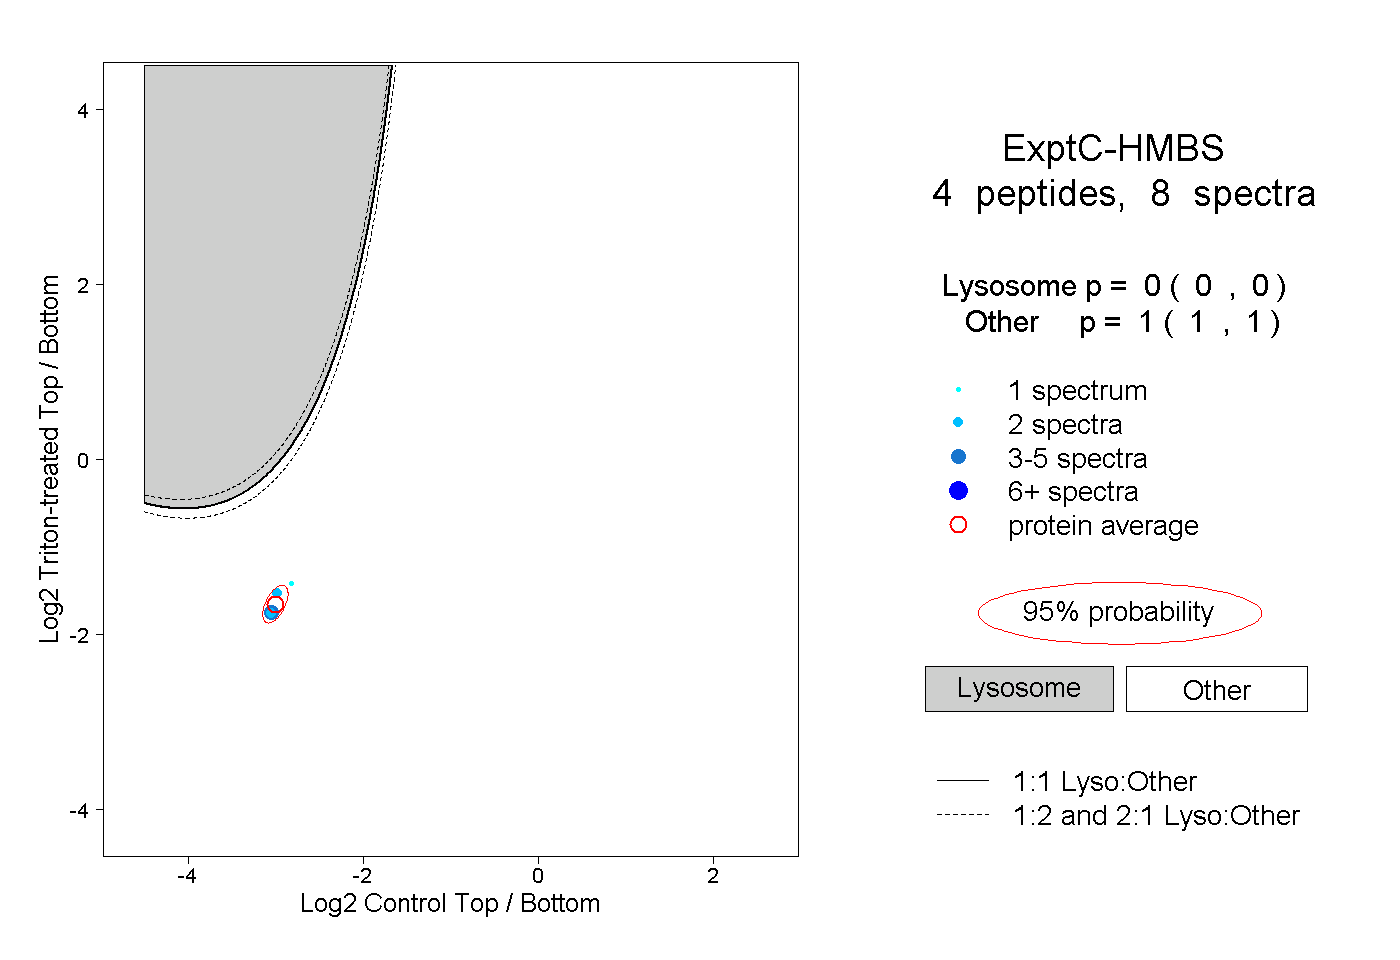
0.000 | 0.000
1.000 | 1.000