 7
7peptides
spectra
0.000 | 0.000
0.000 | 0.000
0.000 | 0.000
0.000 | 0.000
0.000 | 0.000
0.000 | 0.000
0.886 | 0.896
0.103 | 0.113
| Plot | Mito | Lyso | Perox | ER | Golgi | PM | Cytosol | Nucleus | |||||
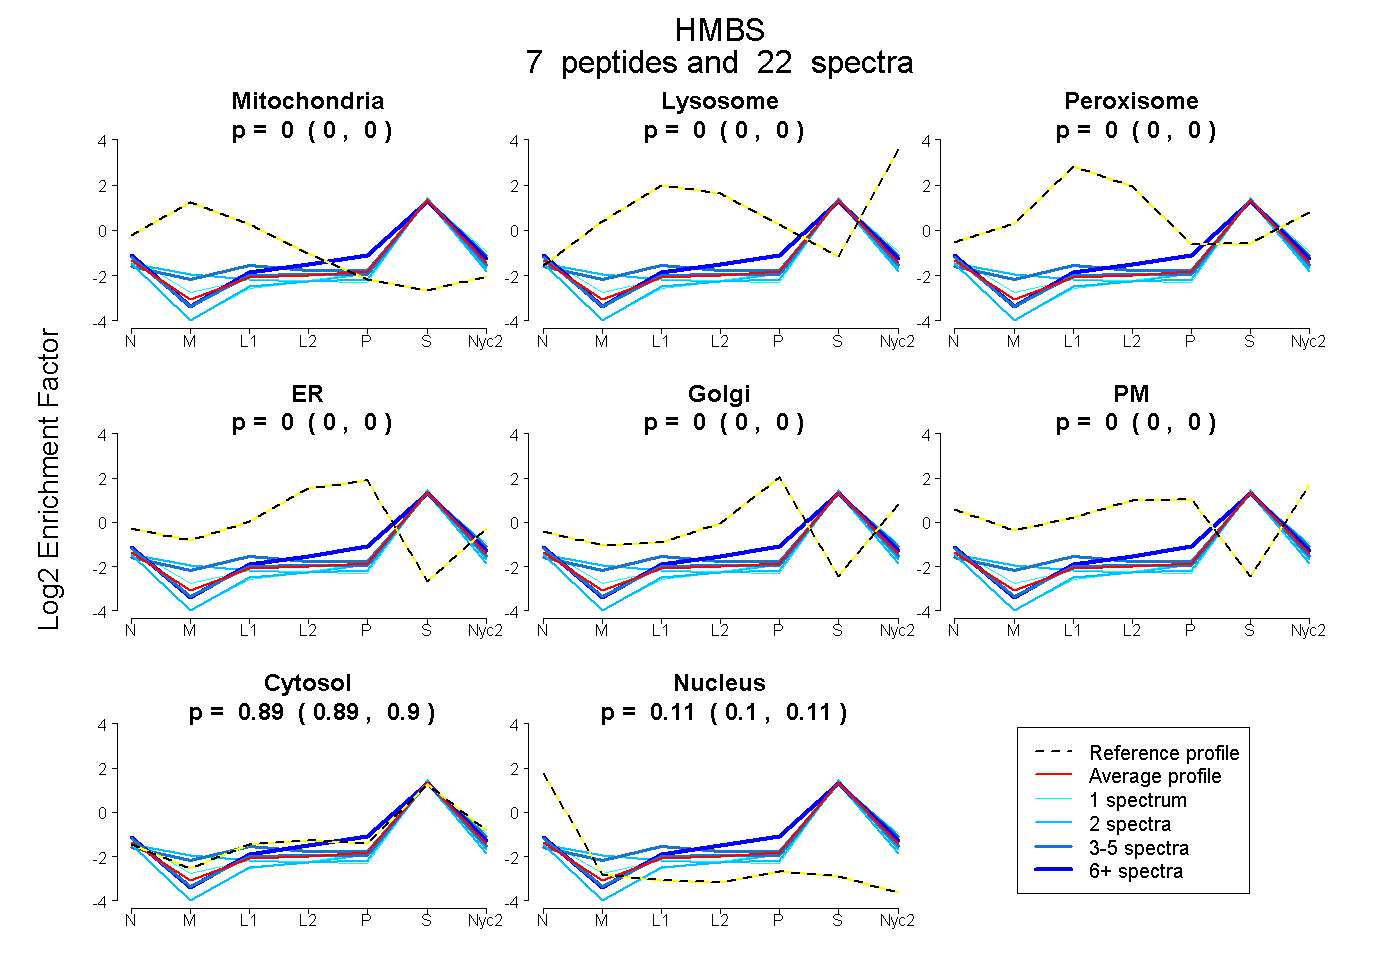
| Expt A |
7 peptides |
22 spectra |
|
0.000 0.000 | 0.000 |
0.000 0.000 | 0.000 |
0.000 0.000 | 0.000 |
0.000 0.000 | 0.000 |
0.000 0.000 | 0.000 |
0.000 0.000 | 0.000 |
0.891 0.886 | 0.896 |
0.109 0.103 | 0.113 |
| 2 spectra, ENPCDAVVFHPK | 0.000 | 0.000 | 0.000 | 0.000 | 0.000 | 0.000 | 0.857 | 0.143 | ||
| 8 spectra, QLNDVR | 0.000 | 0.000 | 0.000 | 0.000 | 0.000 | 0.000 | 0.929 | 0.071 | ||
| 1 spectrum, ILDTALSK | 0.000 | 0.000 | 0.000 | 0.000 | 0.000 | 0.000 | 0.895 | 0.105 | ||
| 4 spectra, MGWQNR | 0.021 | 0.000 | 0.000 | 0.000 | 0.000 | 0.000 | 0.953 | 0.026 | ||
| 4 spectra, SAVGTSSLR | 0.000 | 0.000 | 0.000 | 0.000 | 0.000 | 0.000 | 0.873 | 0.127 | ||
| 2 spectra, NILDVAR | 0.000 | 0.000 | 0.000 | 0.000 | 0.000 | 0.000 | 0.848 | 0.152 | ||
| 1 spectrum, NEVDLVVHSLK | 0.000 | 0.000 | 0.000 | 0.000 | 0.000 | 0.000 | 0.848 | 0.152 |
| Plot | Mito | Lyso or Perox | ER | Golgi | PM | Cytosol | Nucleus | ||||||
| Expt B |
3 peptides |
4 spectra |
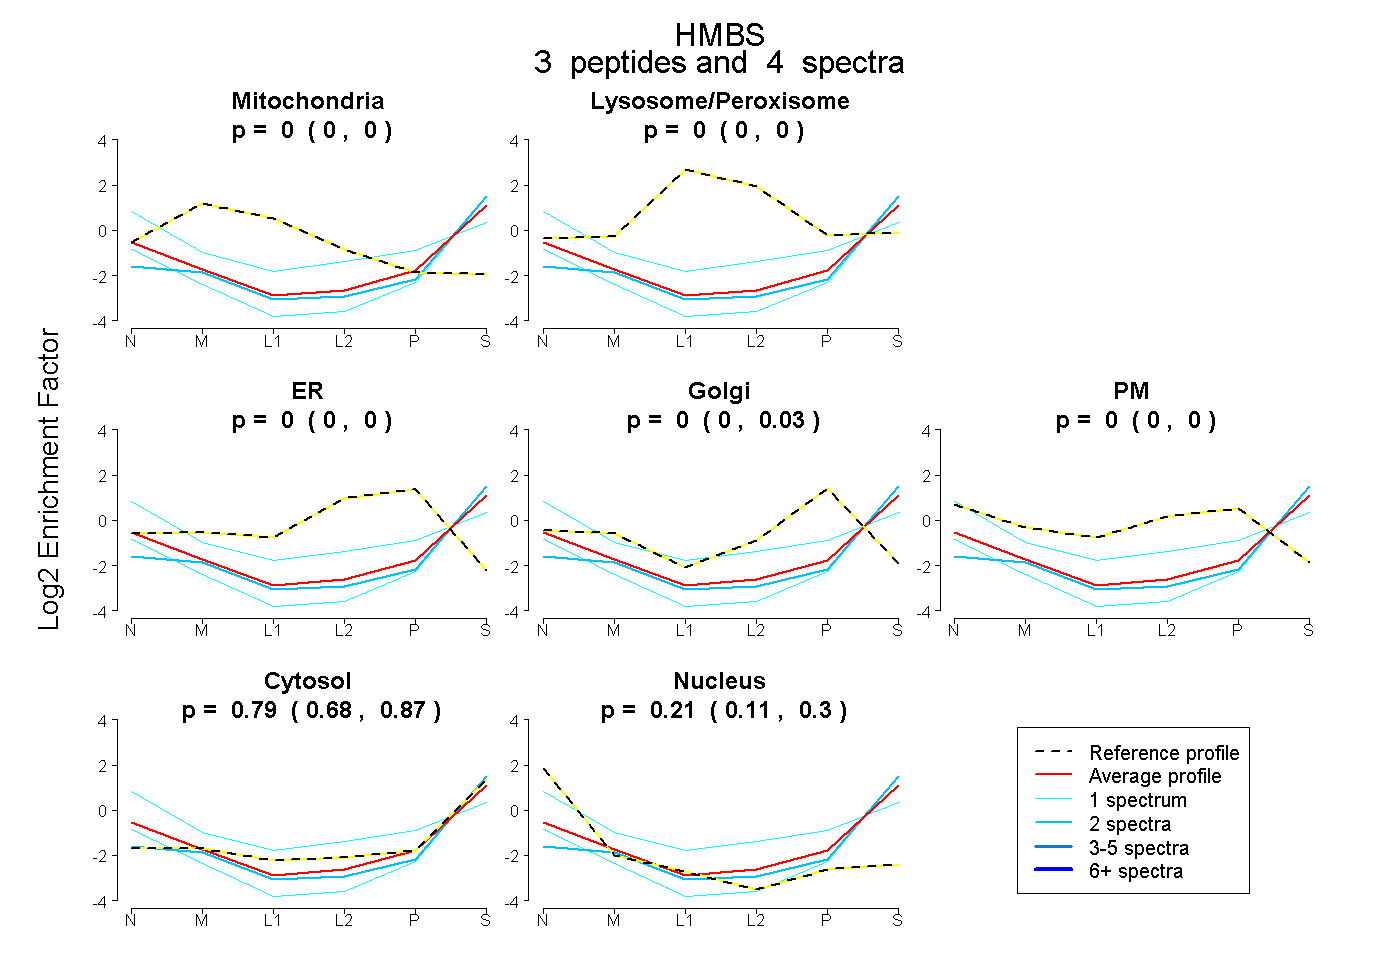 |
0.000 0.000 | 0.000 |
0.000 0.000 | 0.000 |
0.000 0.000 | 0.000 |
0.000 0.000 | 0.026 |
0.000 0.000 | 0.003 |
0.788 0.684 | 0.870 |
0.212 0.109 | 0.297 |
|||
| Plot | Lyso | Other | |||||||||||
| Expt C |
4 peptides |
8 spectra |
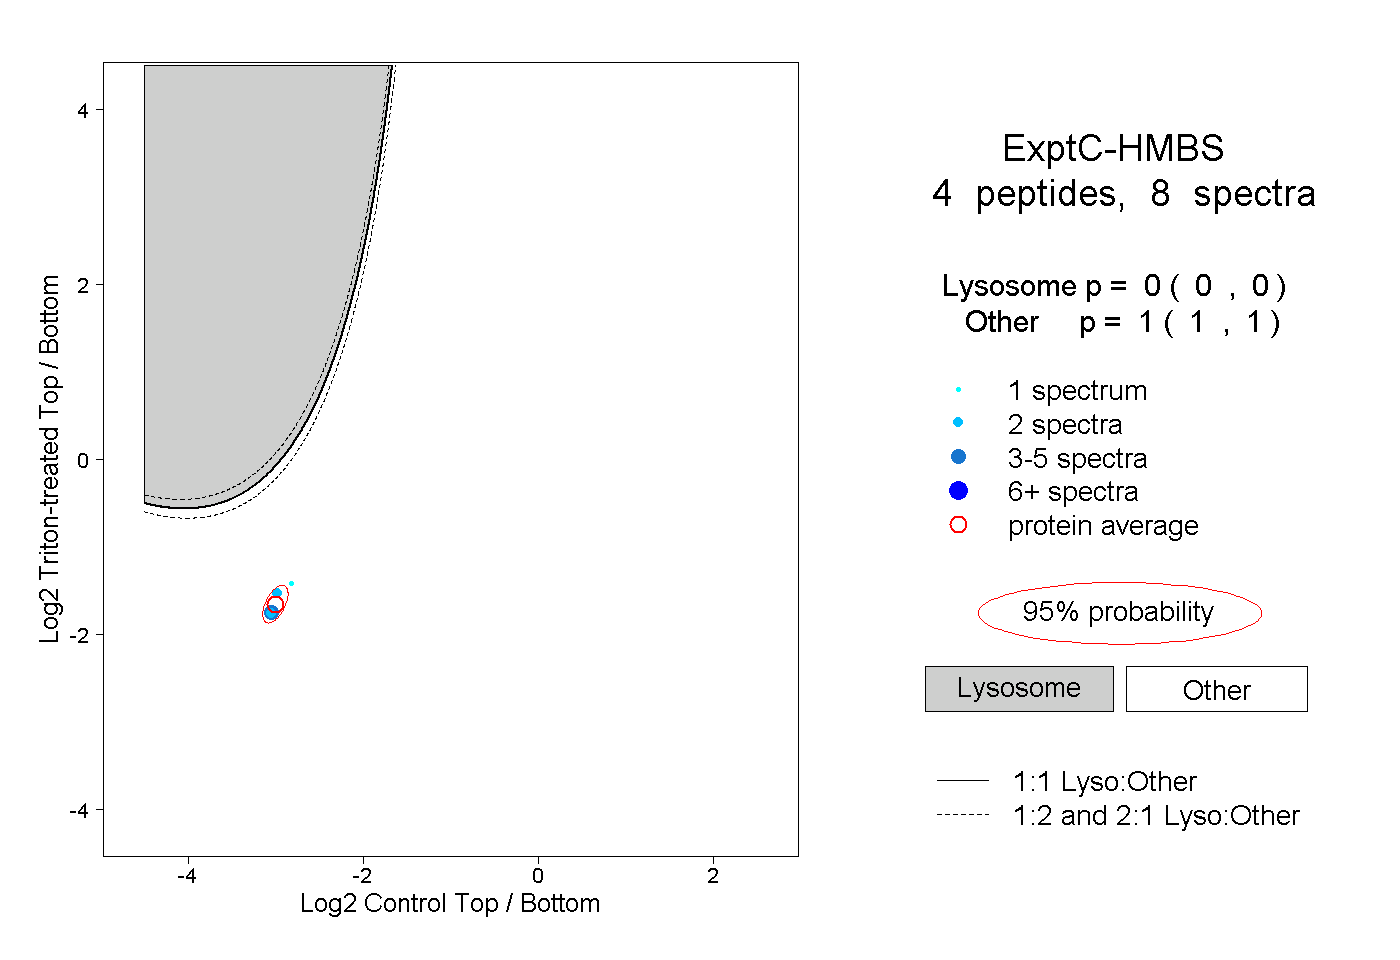 |
0.000 0.000 | 0.000 |
1.000 1.000 | 1.000 |