 5
5peptides
spectra
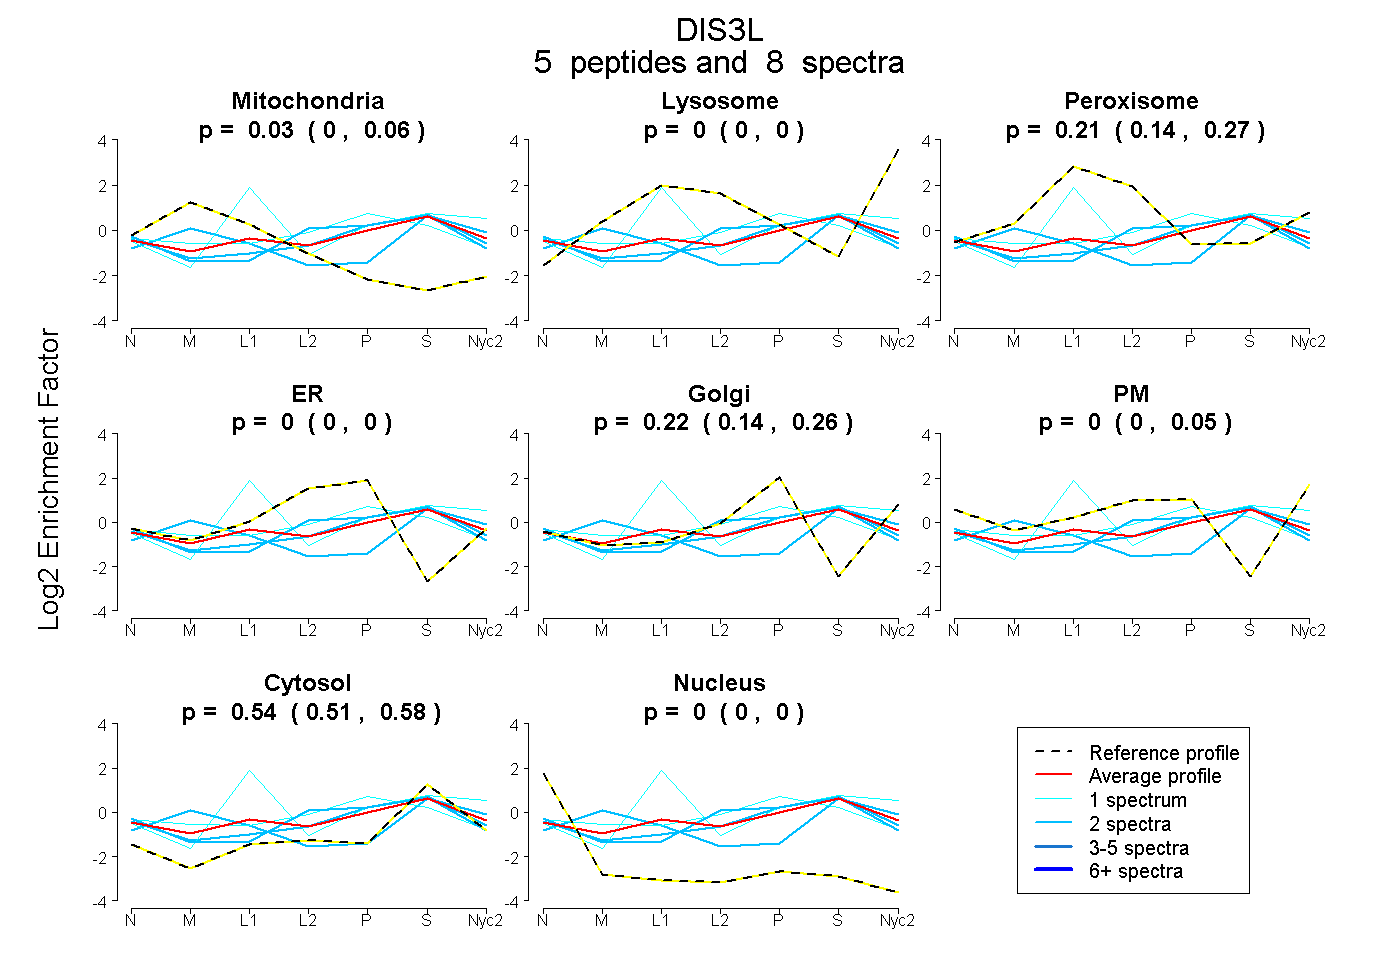
0.000 | 0.063
0.000 | 0.000
0.141 | 0.270
0.000 | 0.000
0.139 | 0.256
0.000 | 0.051
0.506 | 0.578
0.000 | 0.000
1peptide
spectrum
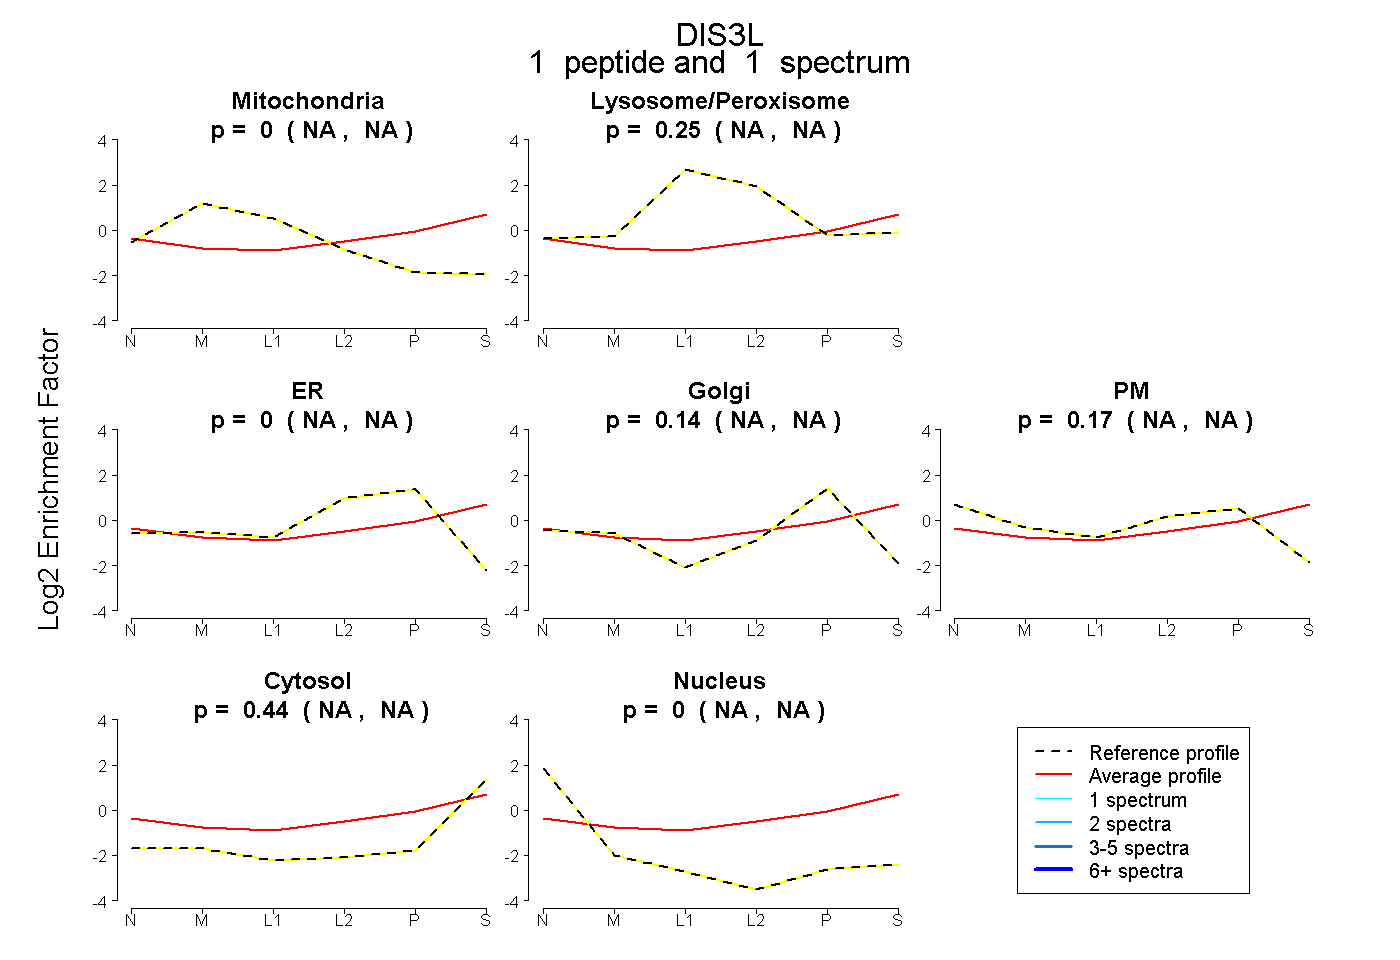
NA | NA
NA | NA
NA | NA
NA | NA
NA | NA
NA | NA
NA | NA
3peptides
spectra
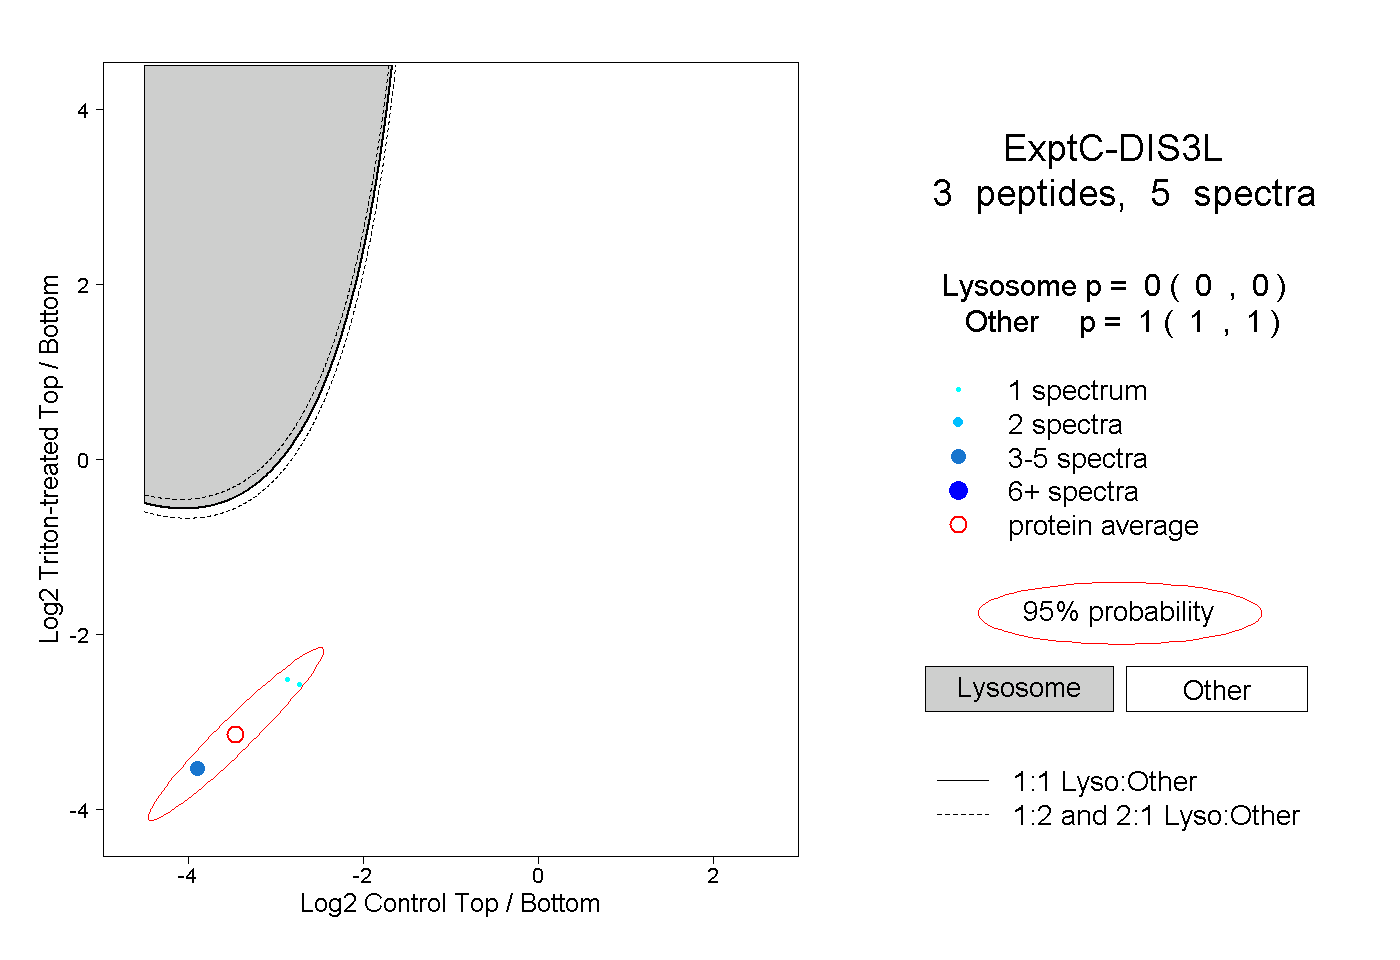
0.000 | 0.000
1.000 | 1.000