 5
5peptides
spectra
0.000 | 0.063
0.000 | 0.000
0.141 | 0.270
0.000 | 0.000
0.139 | 0.256
0.000 | 0.051
0.506 | 0.578
0.000 | 0.000
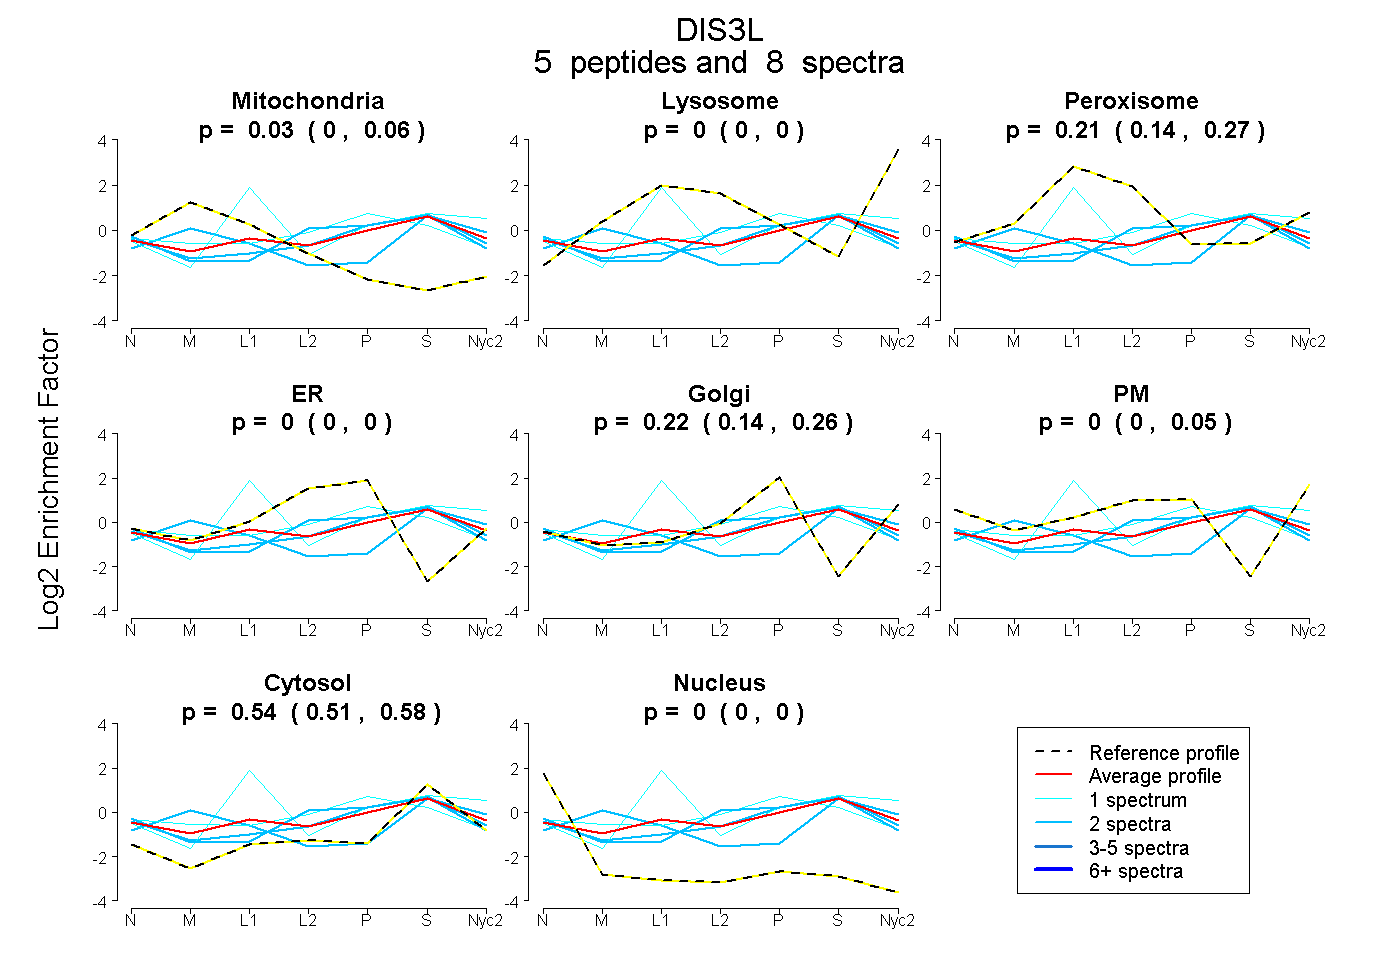
| Plot | Mito | Lyso | Perox | ER | Golgi | PM | Cytosol | Nucleus | |||||
| Expt A |
5 peptides |
8 spectra |
|
0.030 0.000 | 0.063 |
0.000 0.000 | 0.000 |
0.213 0.141 | 0.270 |
0.000 0.000 | 0.000 |
0.215 0.139 | 0.256 |
0.000 0.000 | 0.051 |
0.542 0.506 | 0.578 |
0.000 0.000 | 0.000 |
| 1 spectrum, GIIFMQTACQAVQHQR | 0.035 | 0.000 | 0.097 | 0.319 | 0.096 | 0.000 | 0.453 | 0.000 | ||
| 2 spectra, GAAYLK | 0.293 | 0.151 | 0.000 | 0.000 | 0.000 | 0.000 | 0.556 | 0.000 | ||
| 2 spectra, ISVQPSR | 0.000 | 0.000 | 0.075 | 0.073 | 0.228 | 0.003 | 0.622 | 0.000 | ||
| 1 spectrum, LLMAAISK | 0.000 | 0.067 | 0.413 | 0.000 | 0.065 | 0.000 | 0.454 | 0.000 | ||
| 2 spectra, VIEEEHQEYR | 0.000 | 0.000 | 0.000 | 0.355 | 0.000 | 0.011 | 0.634 | 0.000 |
| Plot | Mito | Lyso or Perox | ER | Golgi | PM | Cytosol | Nucleus | ||||||
| Expt B |
1 peptide |
1 spectrum |
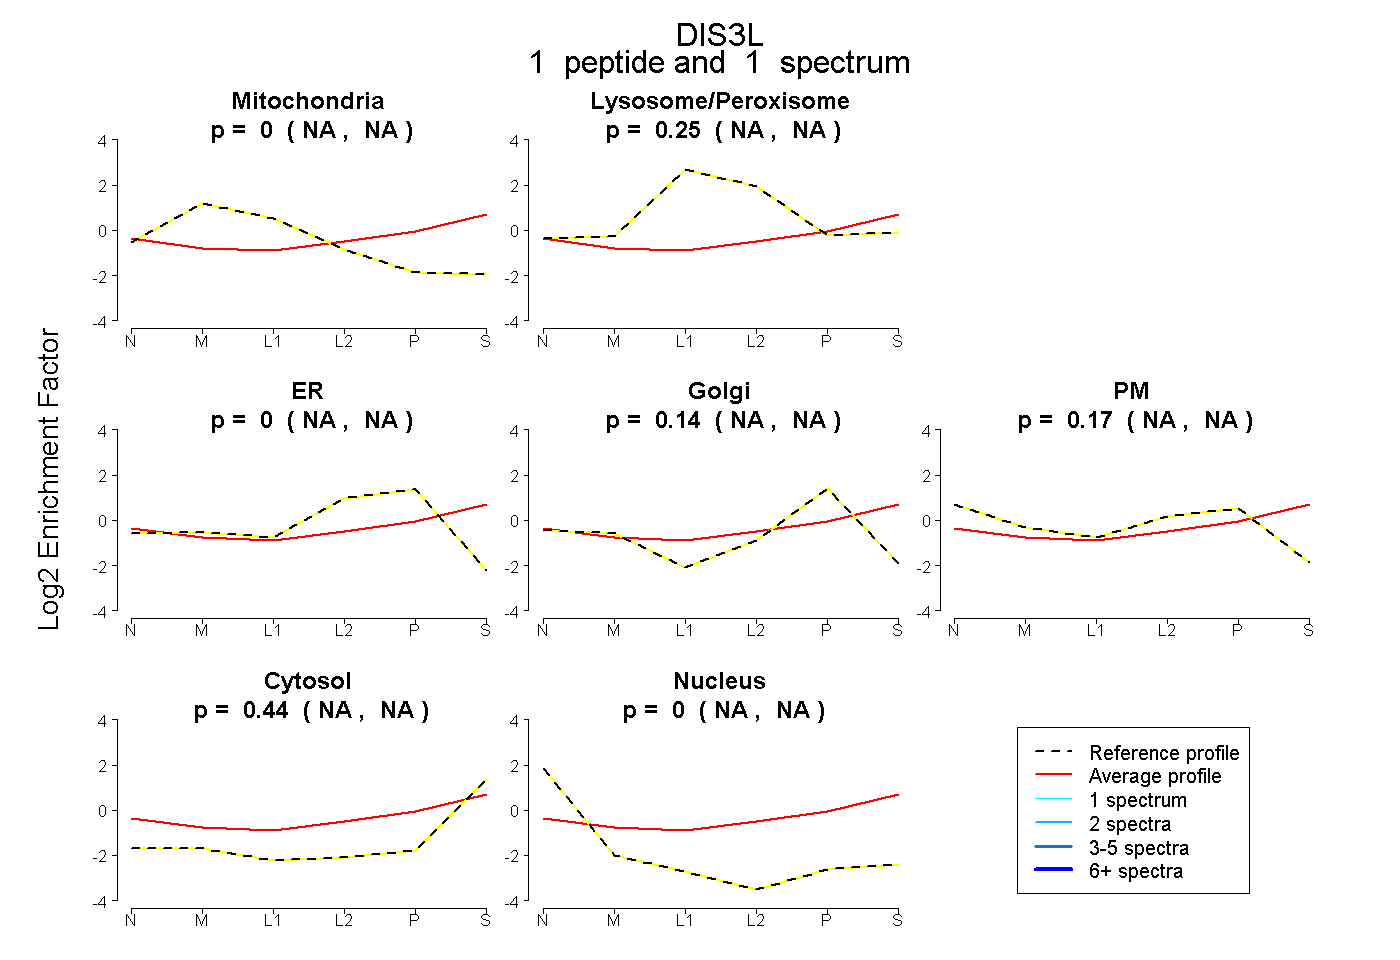 |
0.000 NA | NA |
0.248 NA | NA |
0.000 NA | NA |
0.145 NA | NA |
0.166 NA | NA |
0.441 NA | NA |
0.000 NA | NA |
|||
| Plot | Lyso | Other | |||||||||||
| Expt C |
3 peptides |
5 spectra |
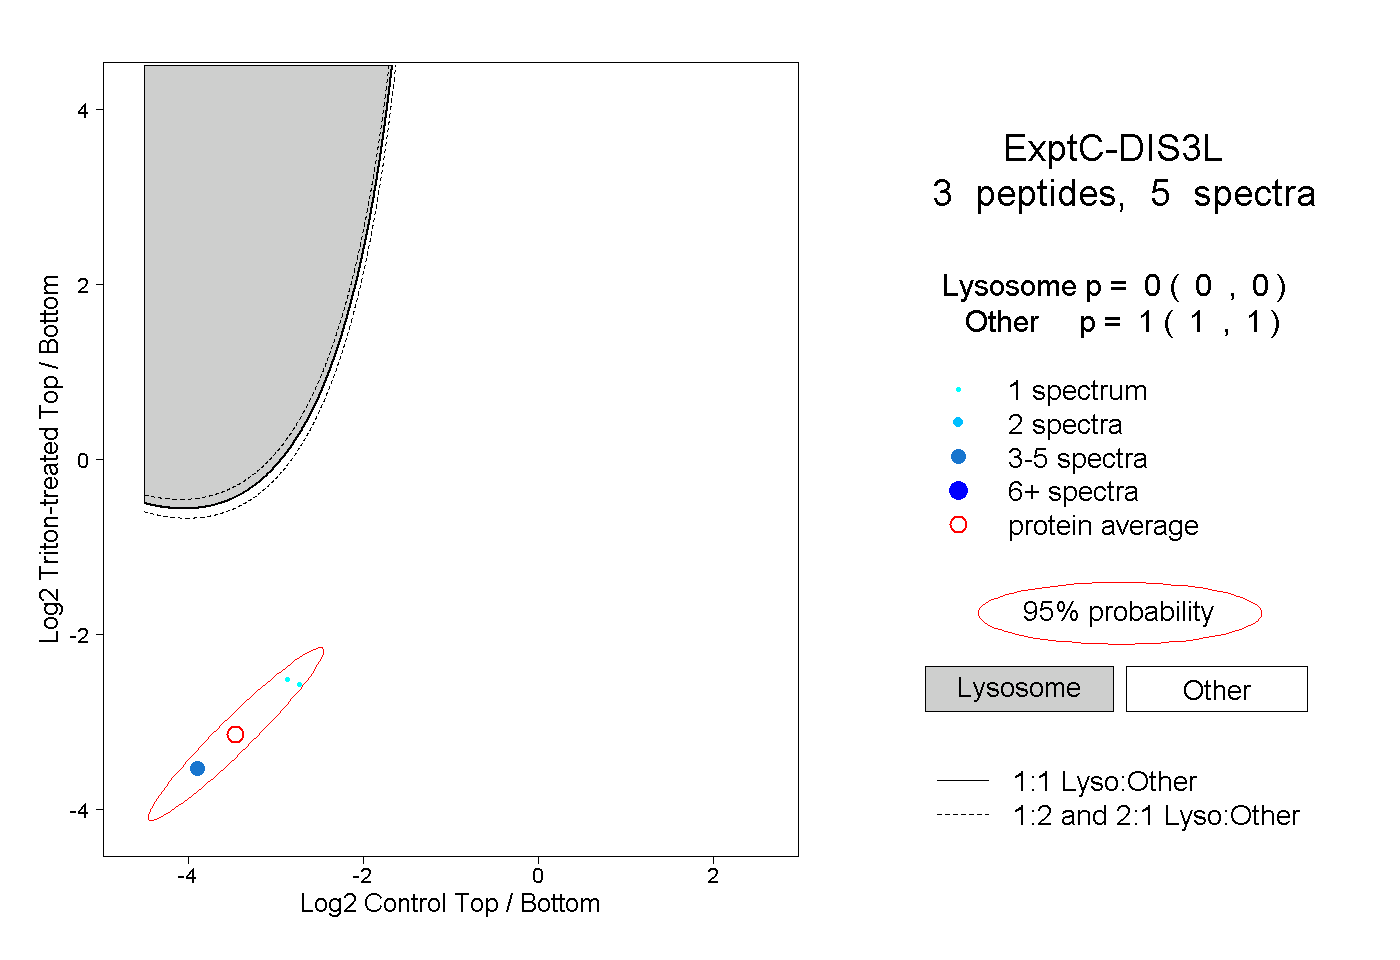 |
0.000 0.000 | 0.000 |
1.000 1.000 | 1.000 |