 6
6peptides
spectra

0.000 | 0.000
0.320 | 0.376
0.000 | 0.000
0.000 | 0.000
0.098 | 0.171
0.026 | 0.131
0.412 | 0.442
0.000 | 0.000
2peptides
spectra
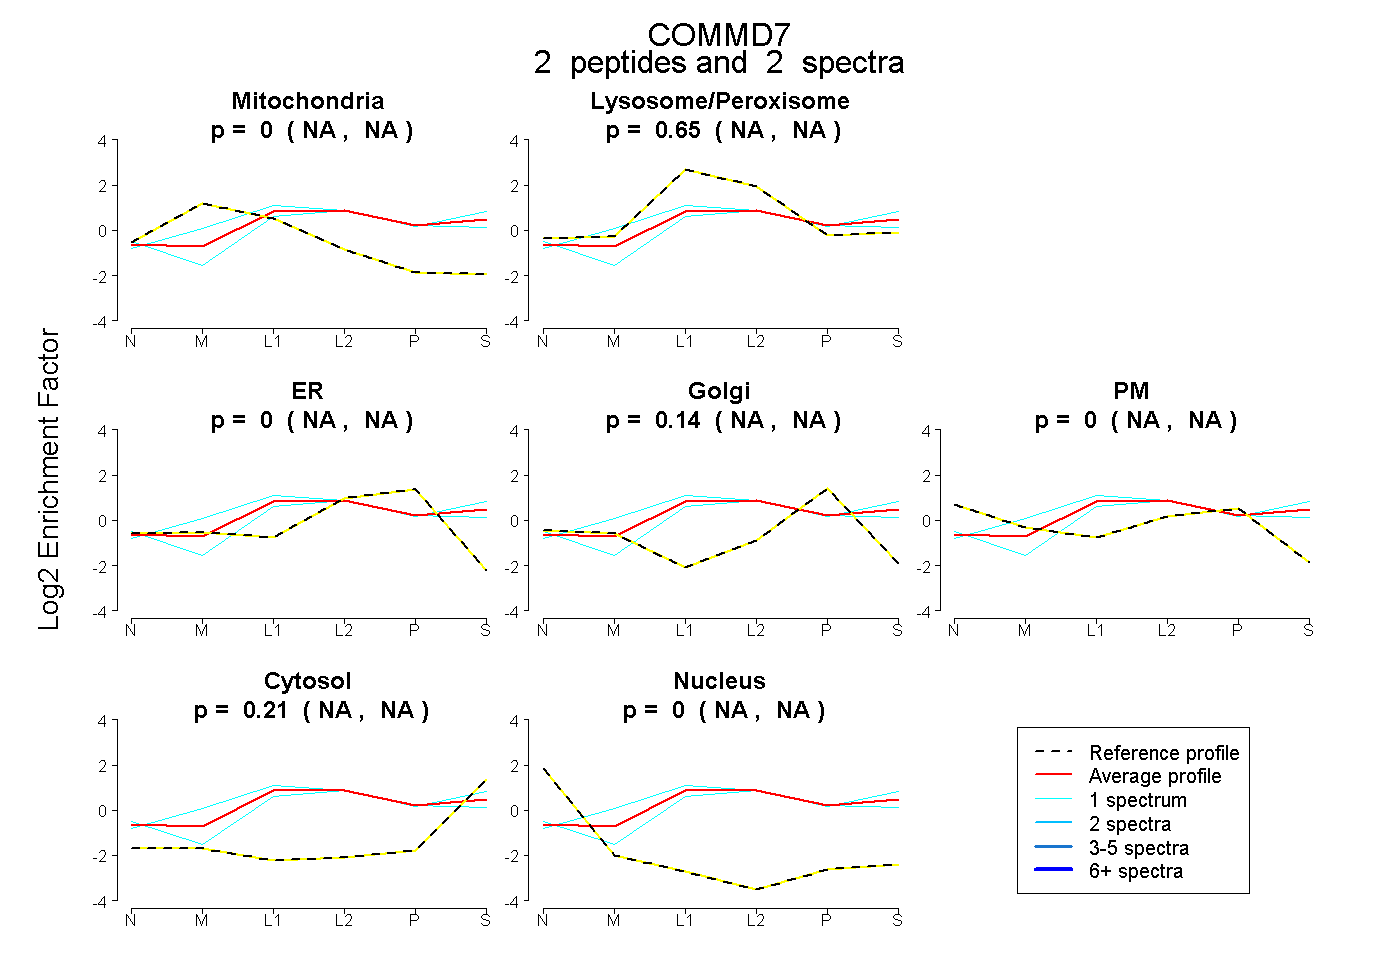
NA | NA
NA | NA
NA | NA
NA | NA
NA | NA
NA | NA
NA | NA
5peptides
spectra
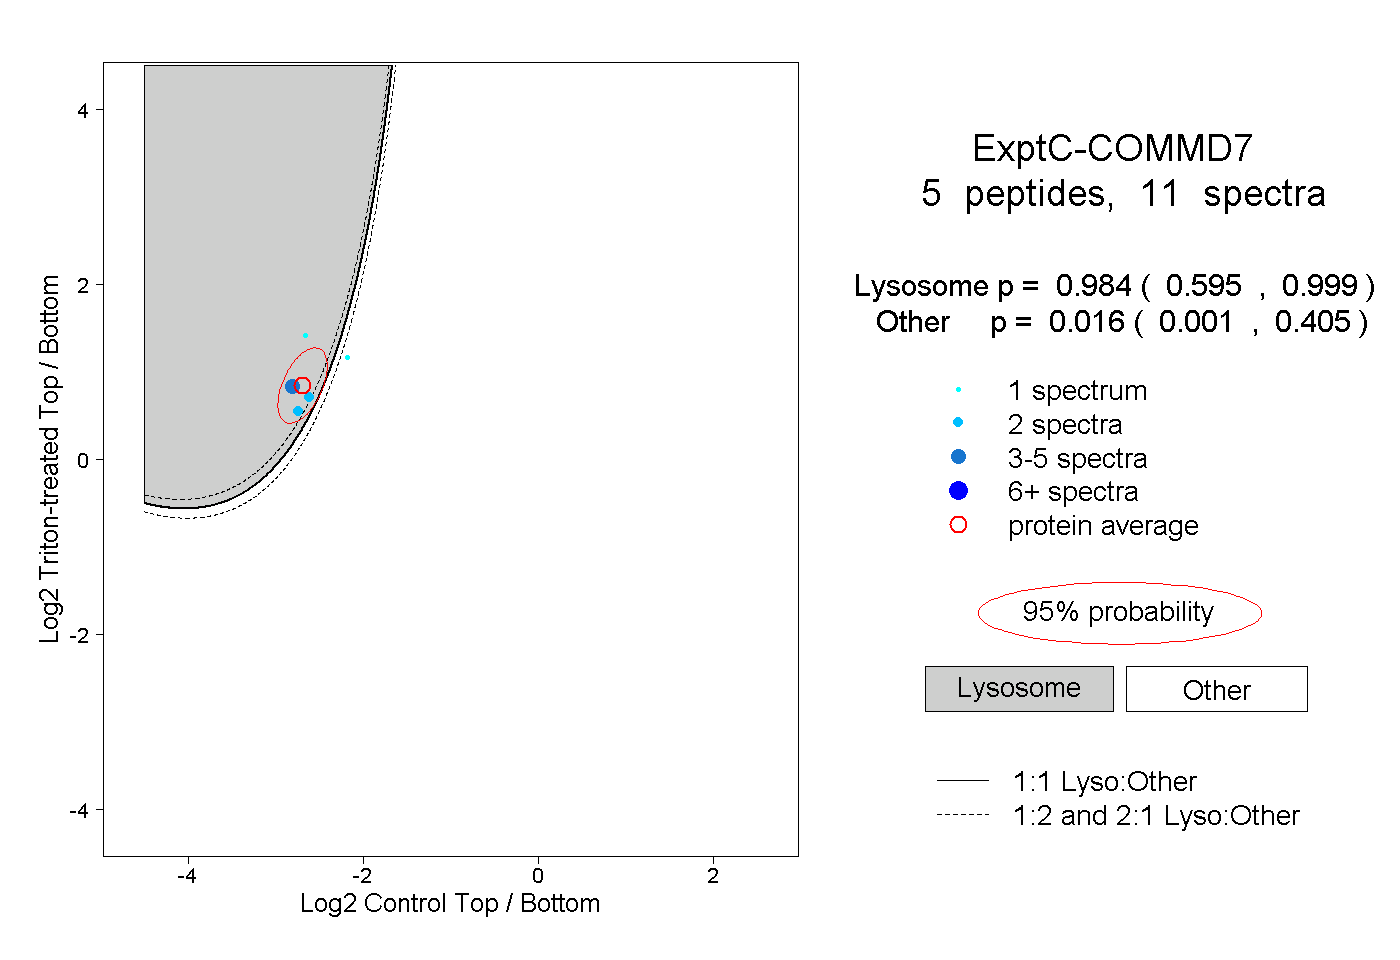
0.595 | 0.999
0.001 | 0.405
1peptide
spectrum
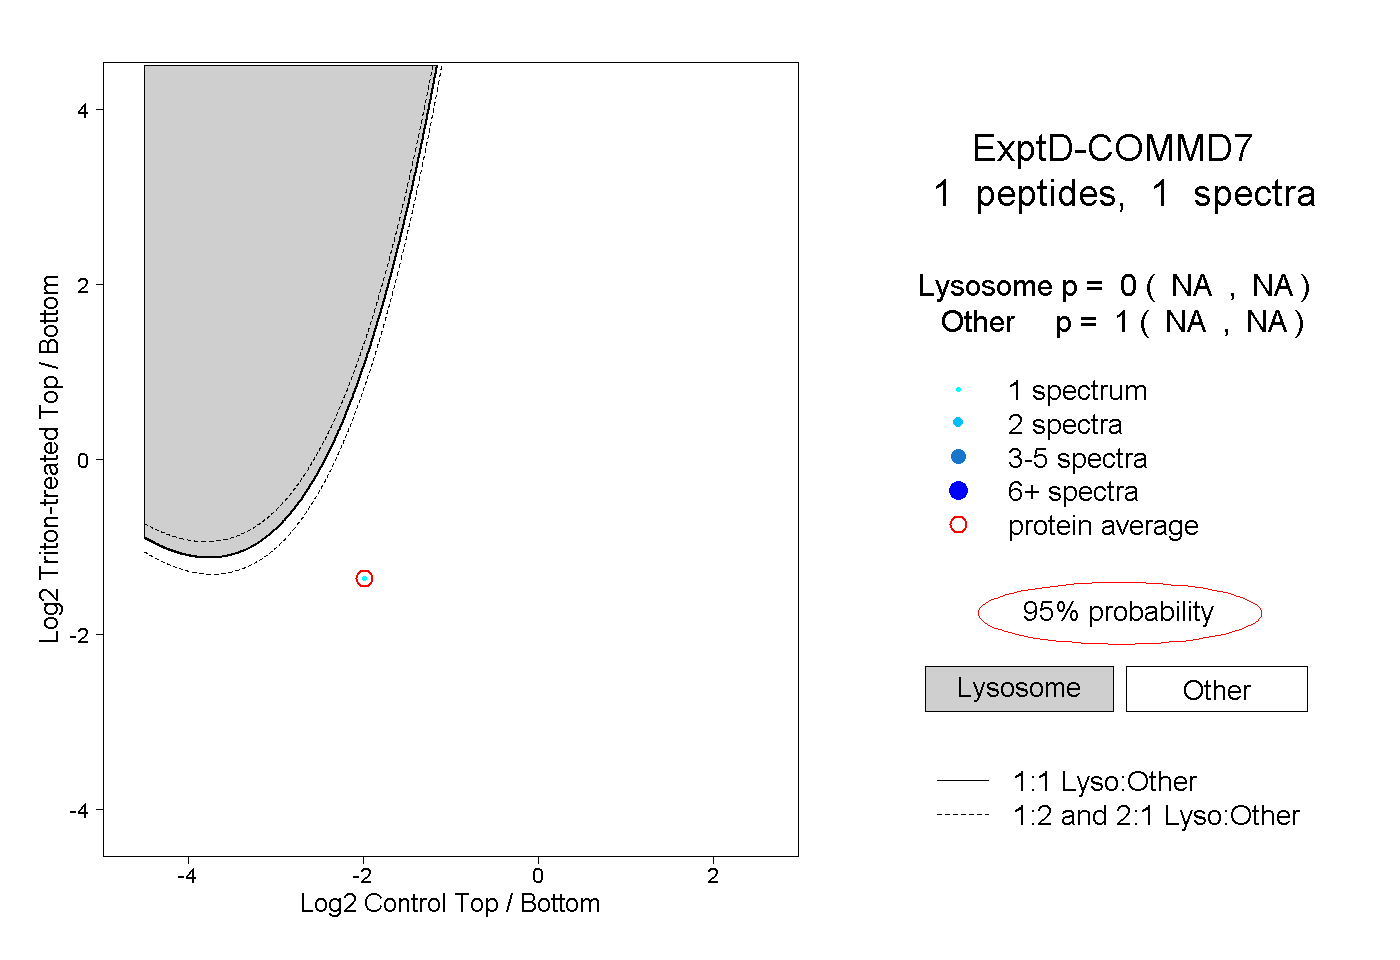
NA | NA
NA | NA