COMMD7
[ENSRNOP00000014038]
Main page
| | | Plot |
Mito |
Lyso |
|
Perox |
ER |
Golgi |
PM |
Cytosol |
Nucleus |
|
| Expt A |
 6
6
peptides |
12
spectra |
 |
0.000
0.000 | 0.000 |
0.352
0.320 | 0.376 |
|
0.000
0.000 | 0.000 |
0.000
0.000 | 0.000 |
0.139
0.098 | 0.171 |
0.081
0.026 | 0.131 |
0.428
0.412 | 0.442 |
0.000
0.000 | 0.000 |
|
| | | Plot |
Mito |
|
Lyso or Perox |
|
ER |
Golgi |
PM |
Cytosol |
Nucleus |
|
| Expt B |
2
peptides |
2
spectra |
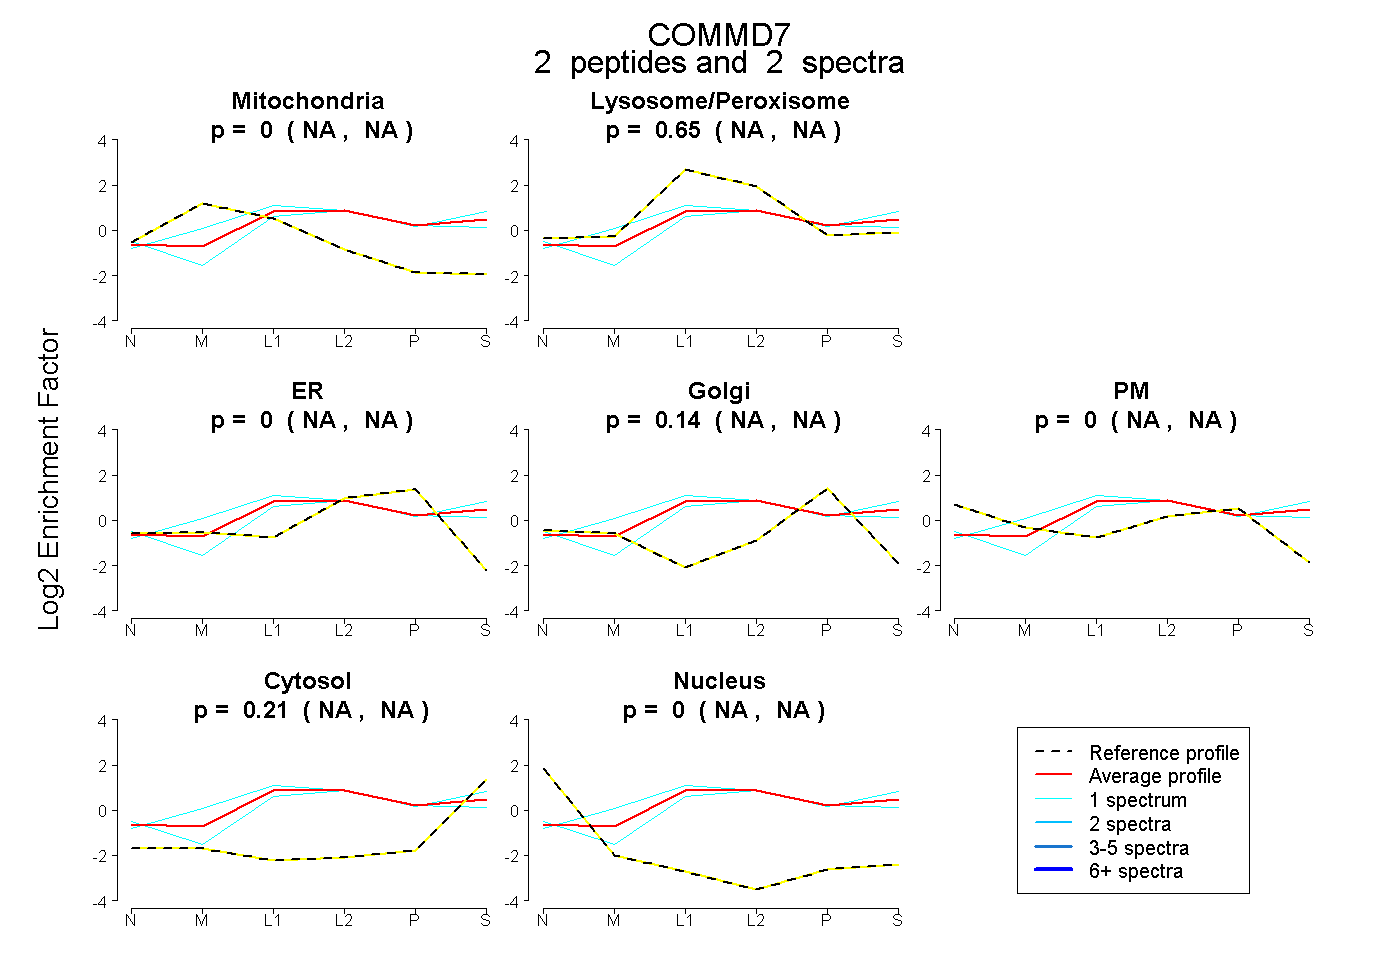 |
0.000
NA | NA |
|
0.646
NA | NA |
|
0.000
NA | NA |
0.142
NA | NA |
0.000
NA | NA |
0.212
NA | NA |
0.000
NA | NA |
|
| | | Plot |
|
Lyso |
|
|
|
|
|
|
|
Other |
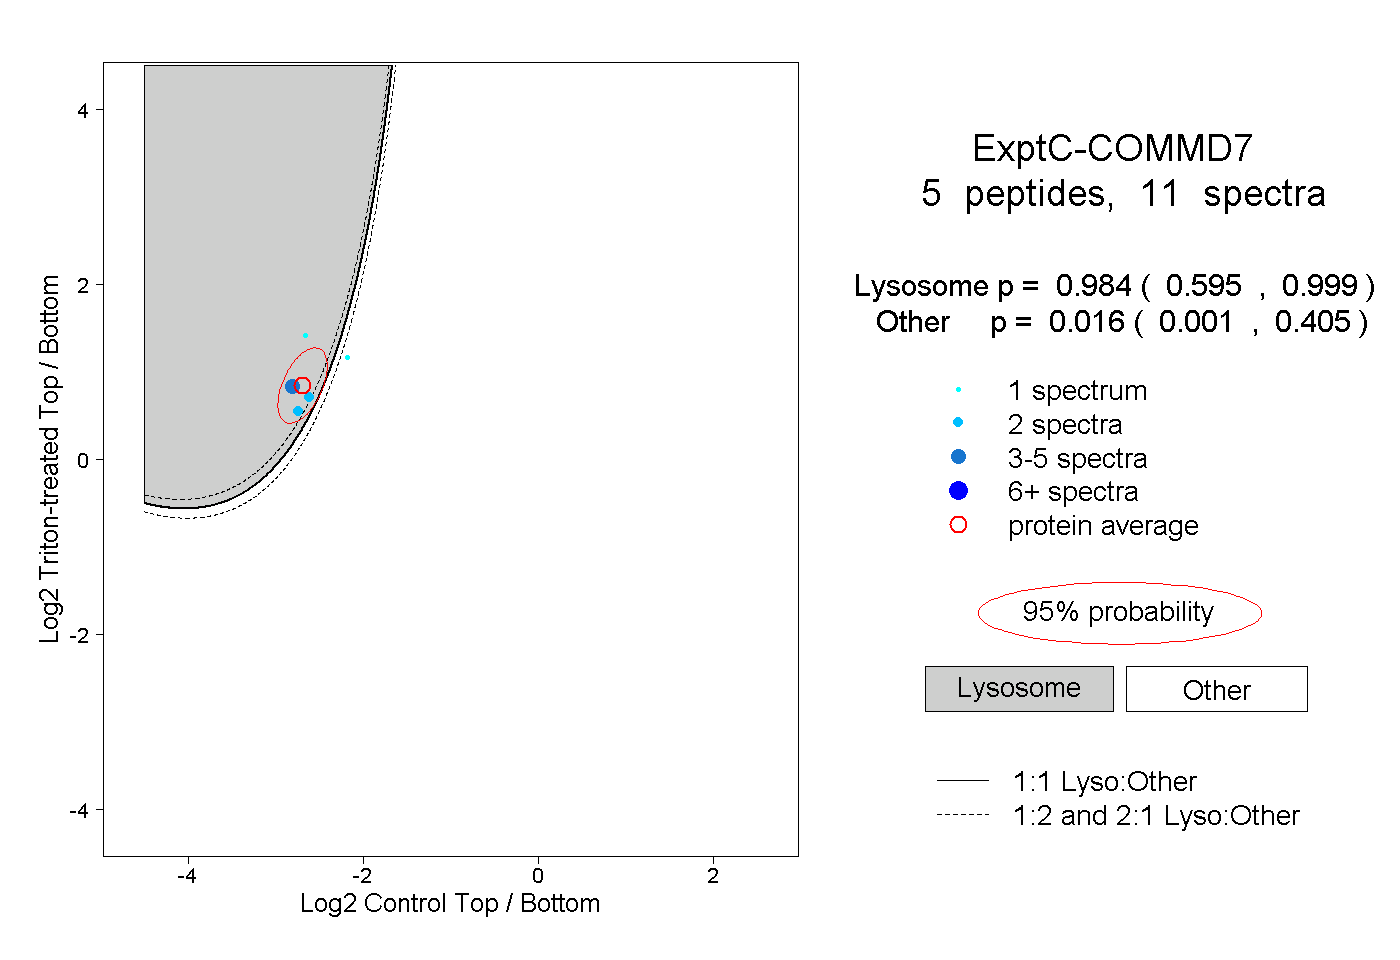
| Expt C |
5
peptides |
11
spectra |
 |
|
0.984
0.595 | 0.999 |
|
|
|
|
|
|
|
0.016
0.001 | 0.405 |
| 5 spectra, ATYFSEK |
|
0.997 |
|
|
|
|
|
|
|
0.003 |
| 2 spectra, VGSIFLQLK |
|
0.915 |
|
|
|
|
|
|
|
0.085 |
| 2 spectra, SLLLVPNGALK |
|
0.847 |
|
|
|
|
|
|
|
0.153 |
| 1 spectrum, GLTAEQVR |
|
1.000 |
|
|
|
|
|
|
|
0.000 |
| 1 spectrum, FGVTSGSSELEK |
|
0.046 |
|
|
|
|
|
|
|
0.954 |
| | | Plot |
|
Lyso |
|
|
|
|
|
|
|
Other |
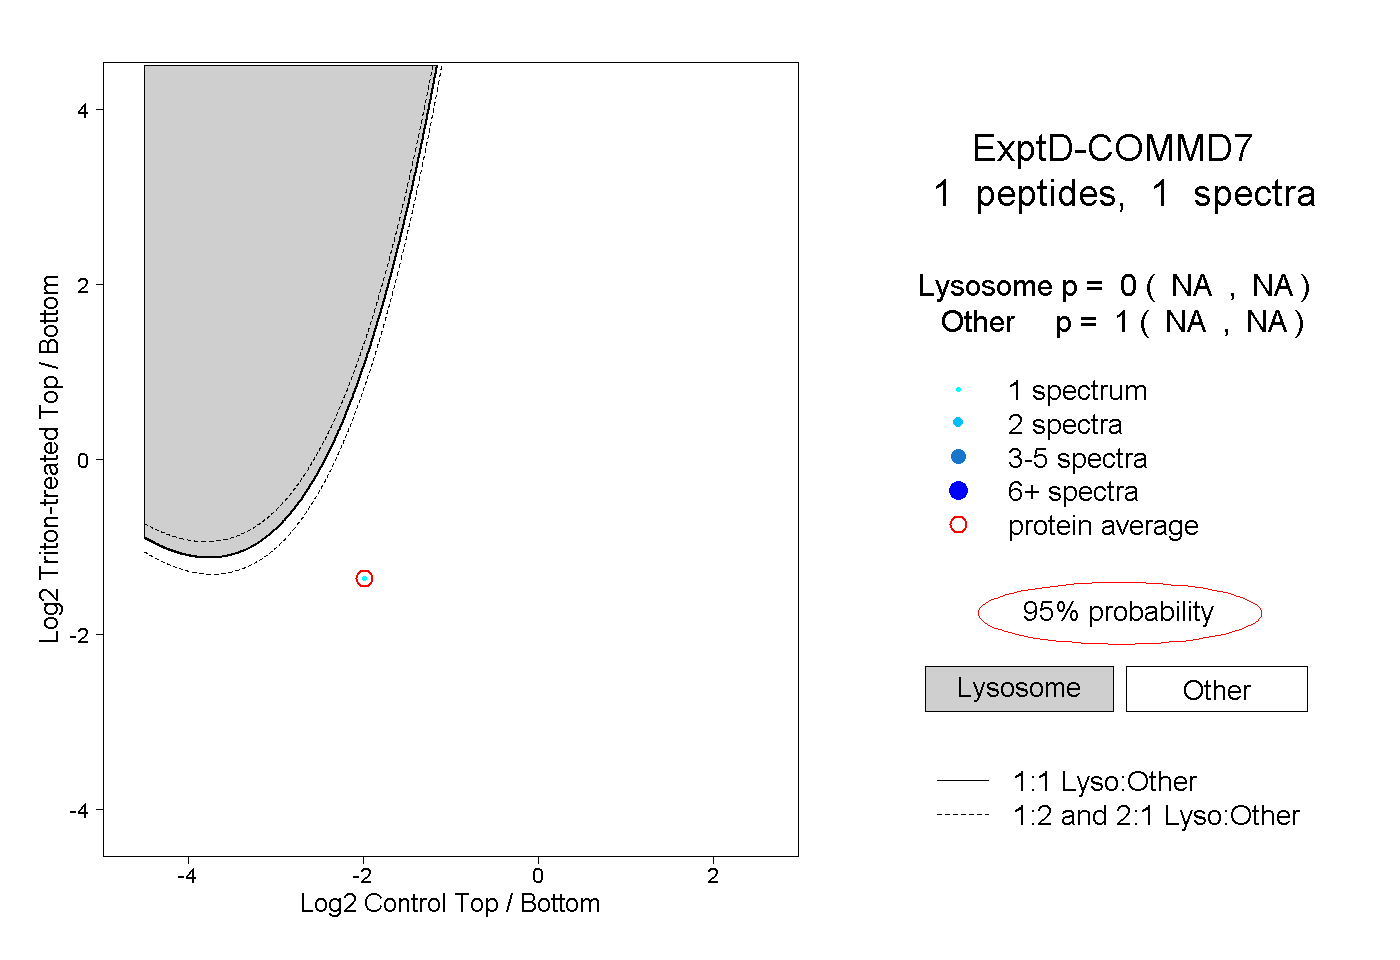
| Expt D |
1
peptide |
1
spectrum |
 |
|
0.000
NA | NA |
|
|
|
|
|
|
|
1.000
NA | NA |