 18
18peptides
spectra
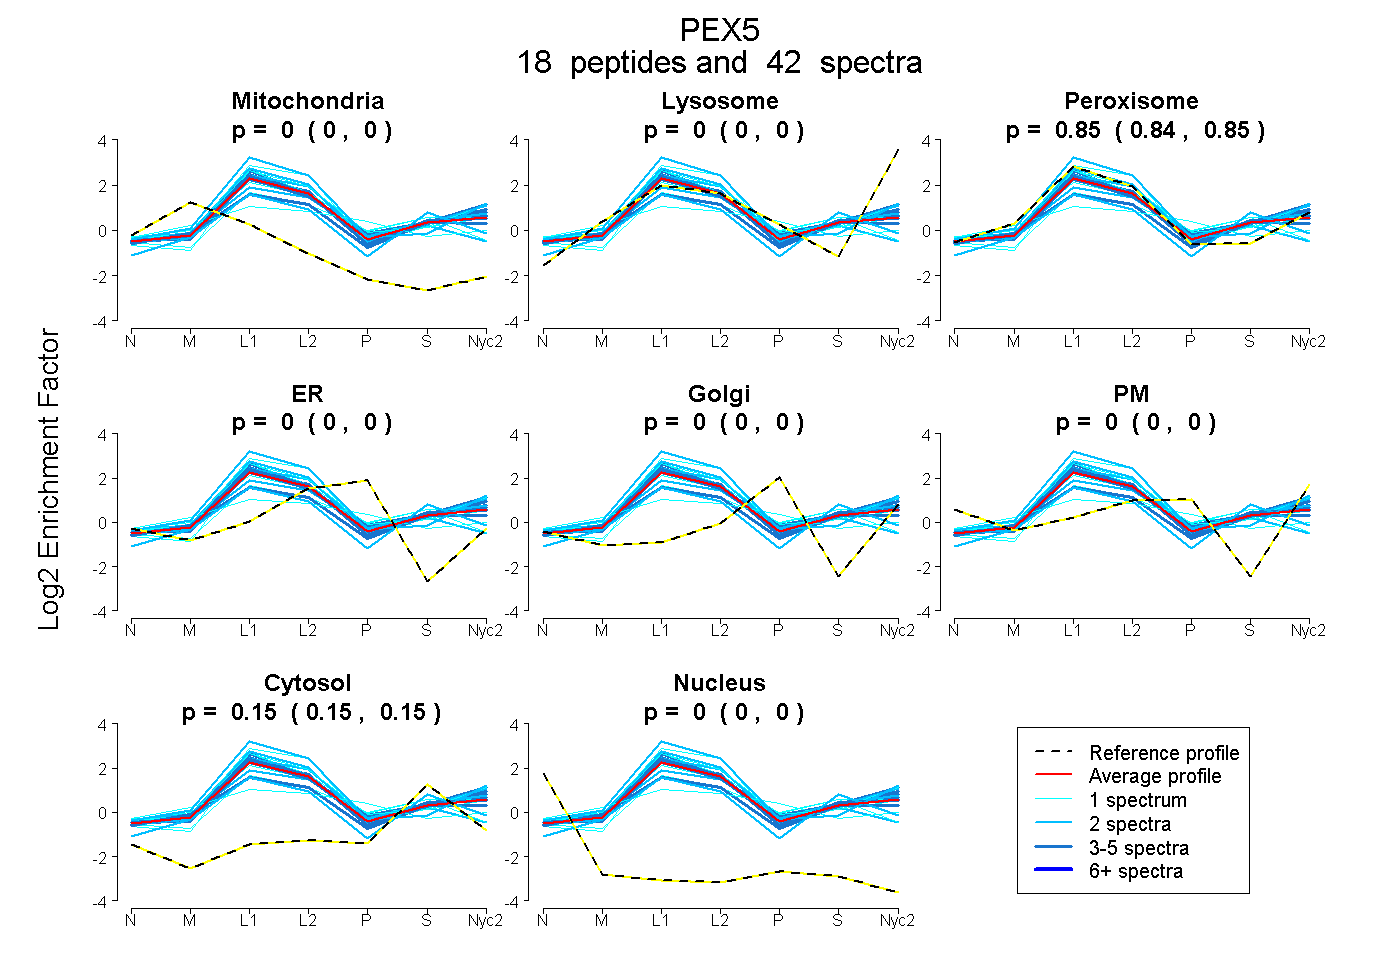
0.000 | 0.000
0.000 | 0.000
0.845 | 0.853
0.000 | 0.000
0.000 | 0.000
0.000 | 0.000
0.146 | 0.155
0.000 | 0.000
5peptides
spectra
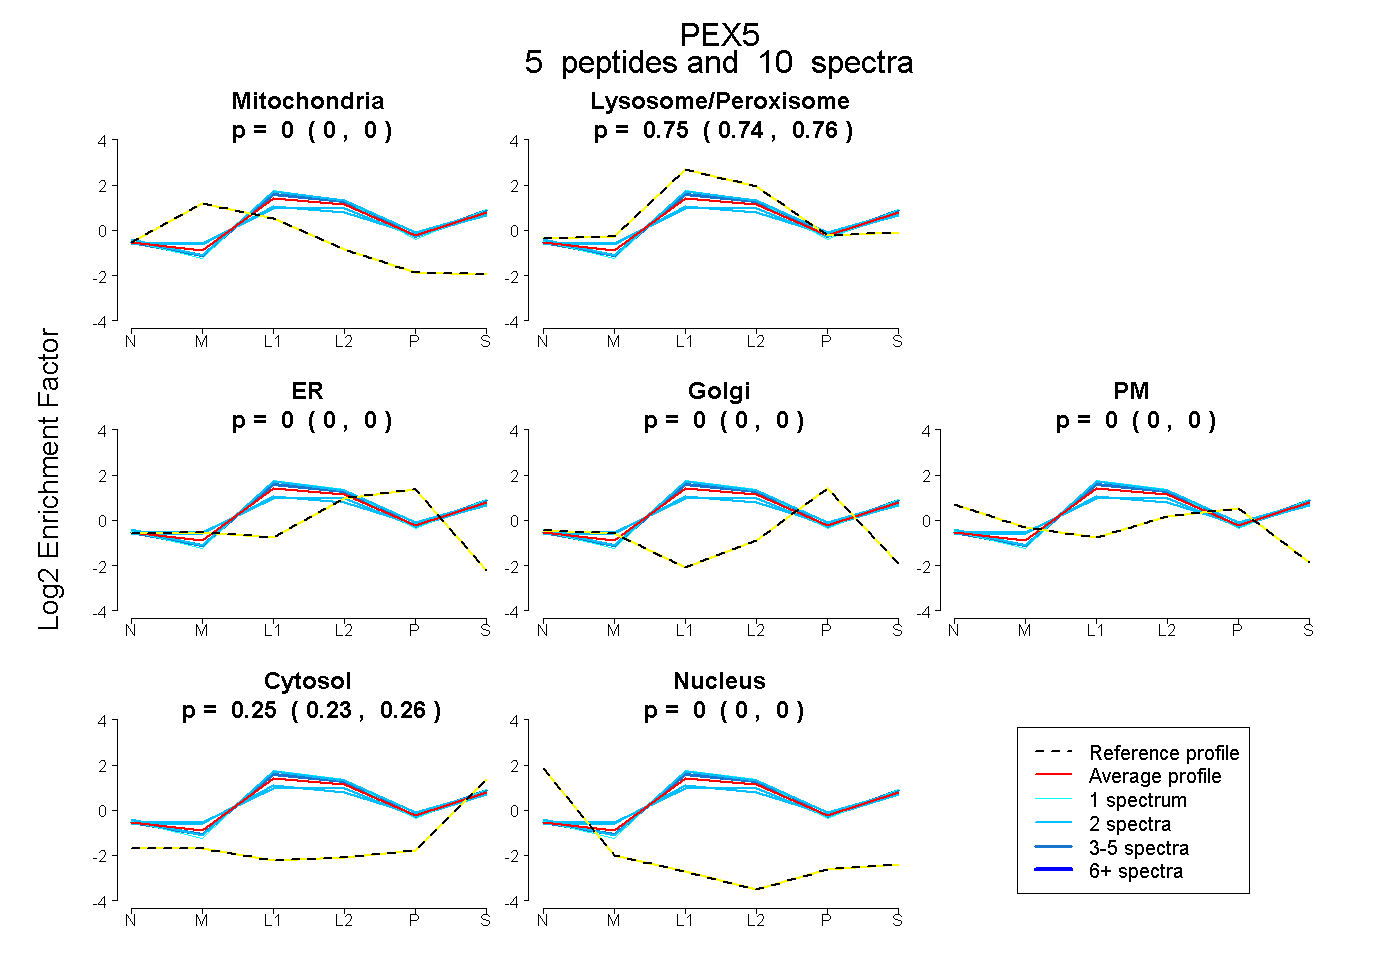
0.000 | 0.000
0.741 | 0.764
0.000 | 0.000
0.000 | 0.000
0.000 | 0.000
0.234 | 0.257
0.000 | 0.000
21peptides
spectra
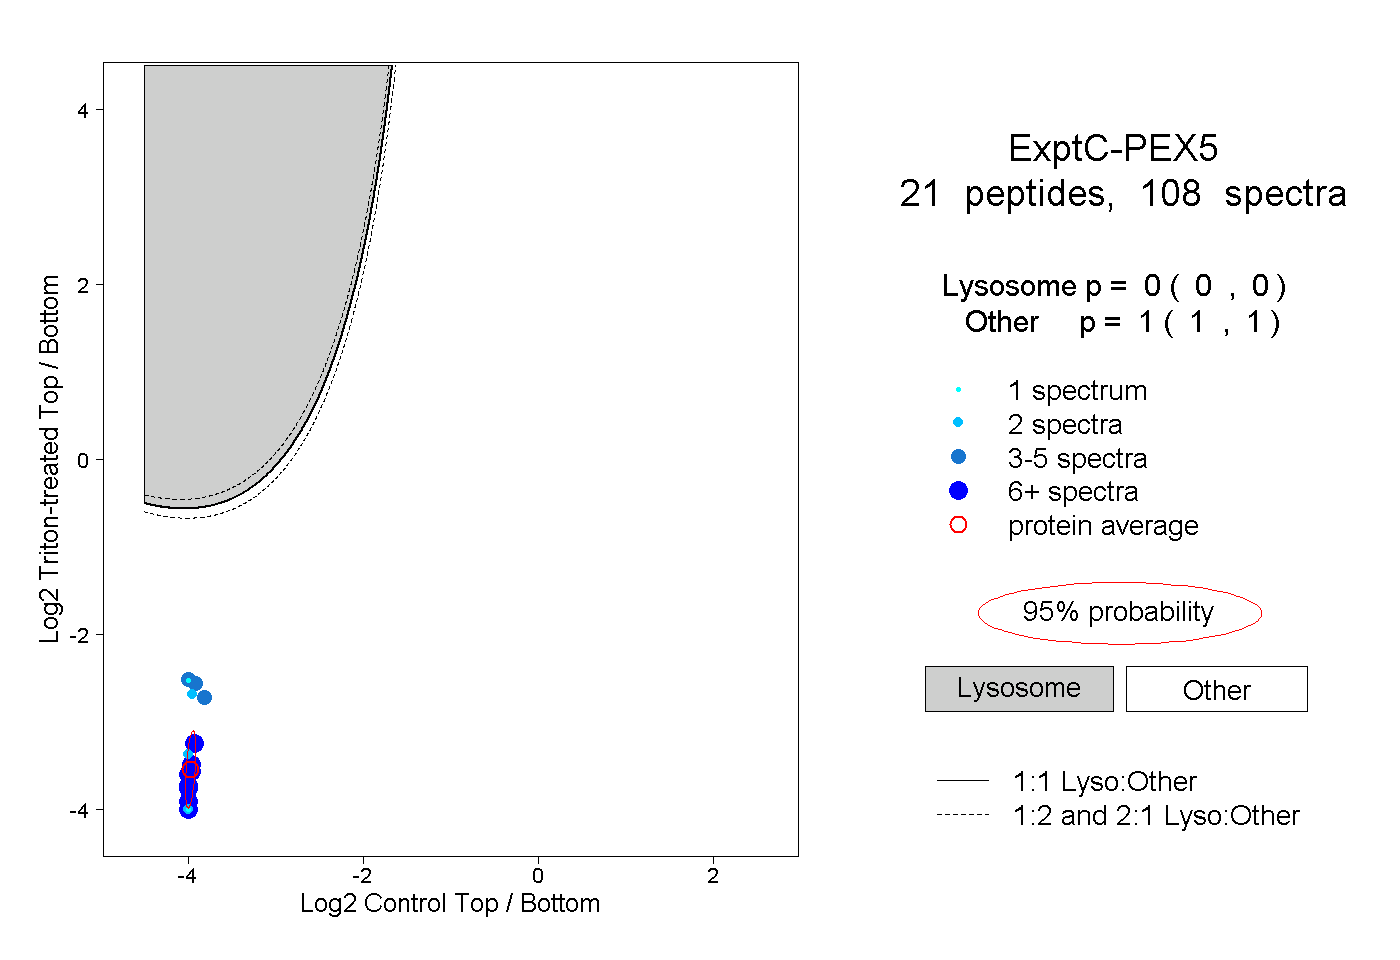
0.000 | 0.000
1.000 | 1.000
4peptides
spectra
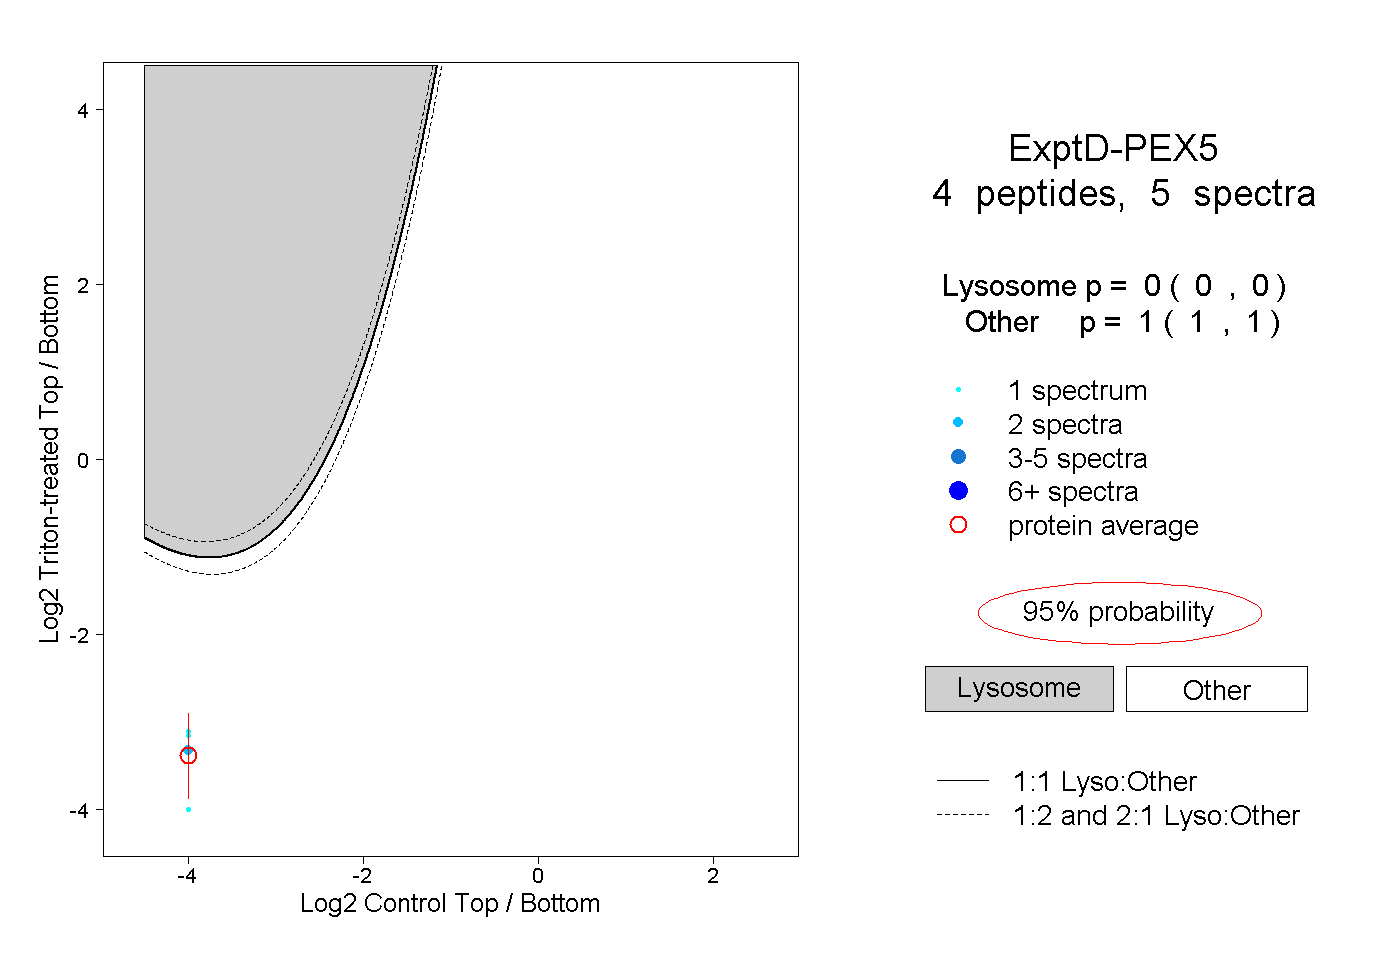
0.000 | 0.000
1.000 | 1.000