 2
2peptides
spectra
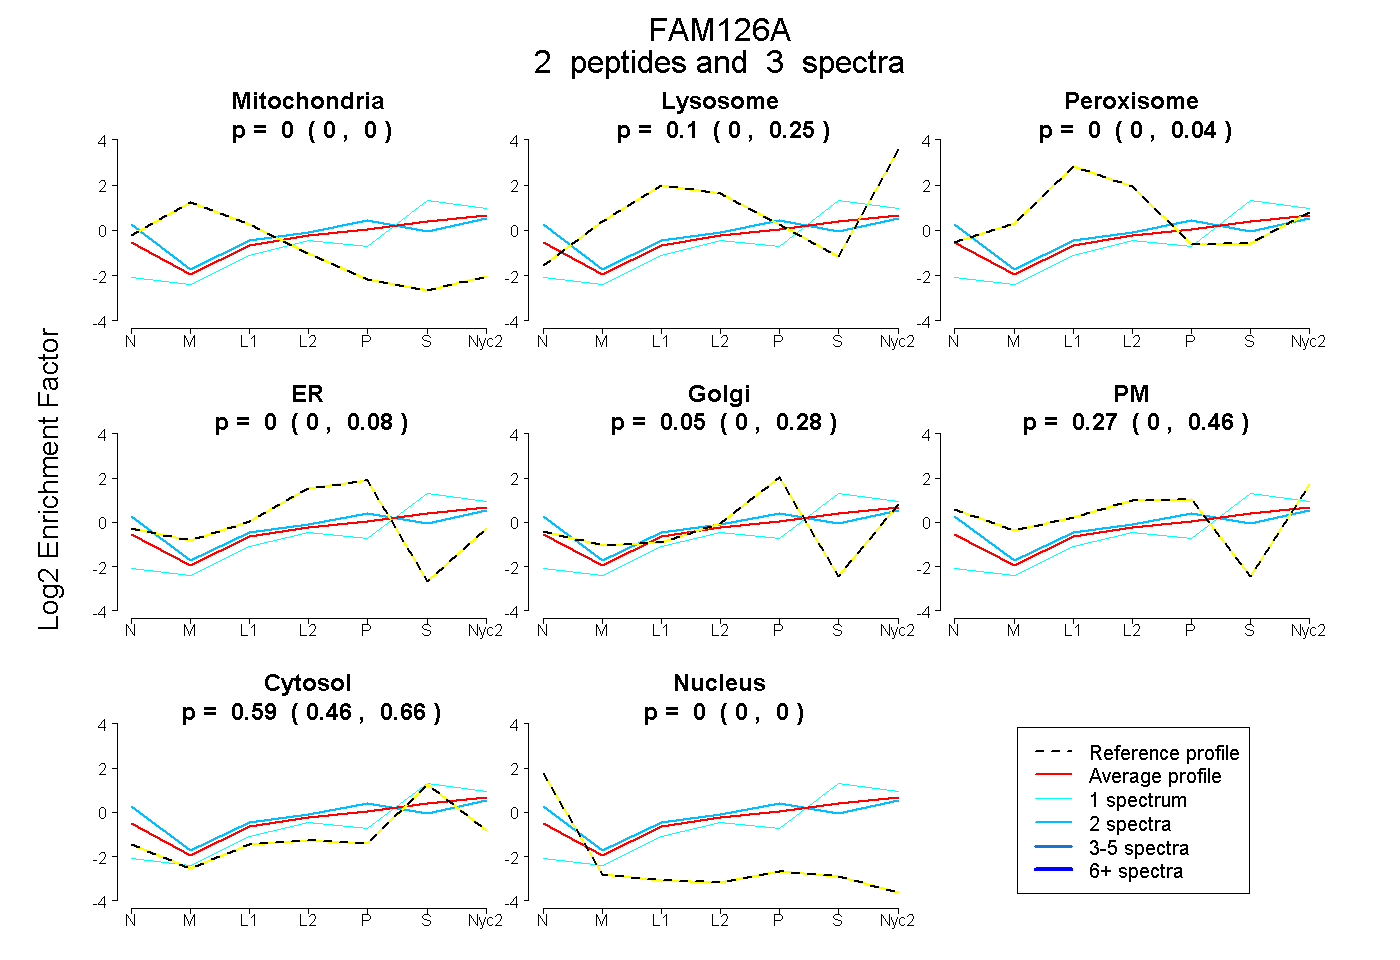
0.000 | 0.000
0.000 | 0.248
0.000 | 0.043
0.000 | 0.076
0.000 | 0.282
0.000 | 0.457
0.462 | 0.661
0.000 | 0.000
3peptides
spectra
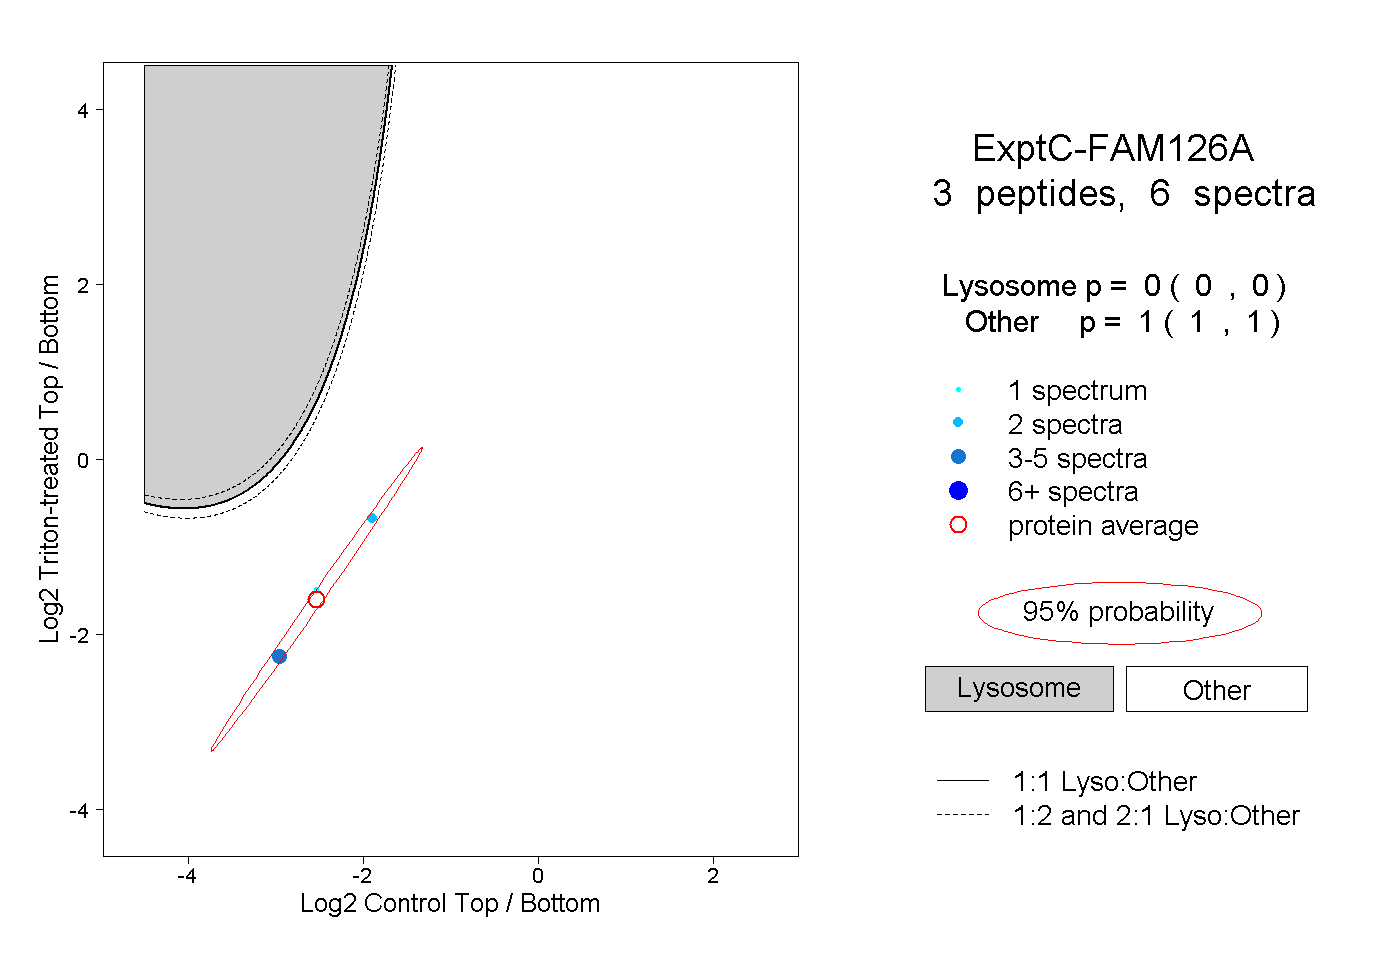
0.000 | 0.000
1.000 | 1.000
1peptide
spectrum
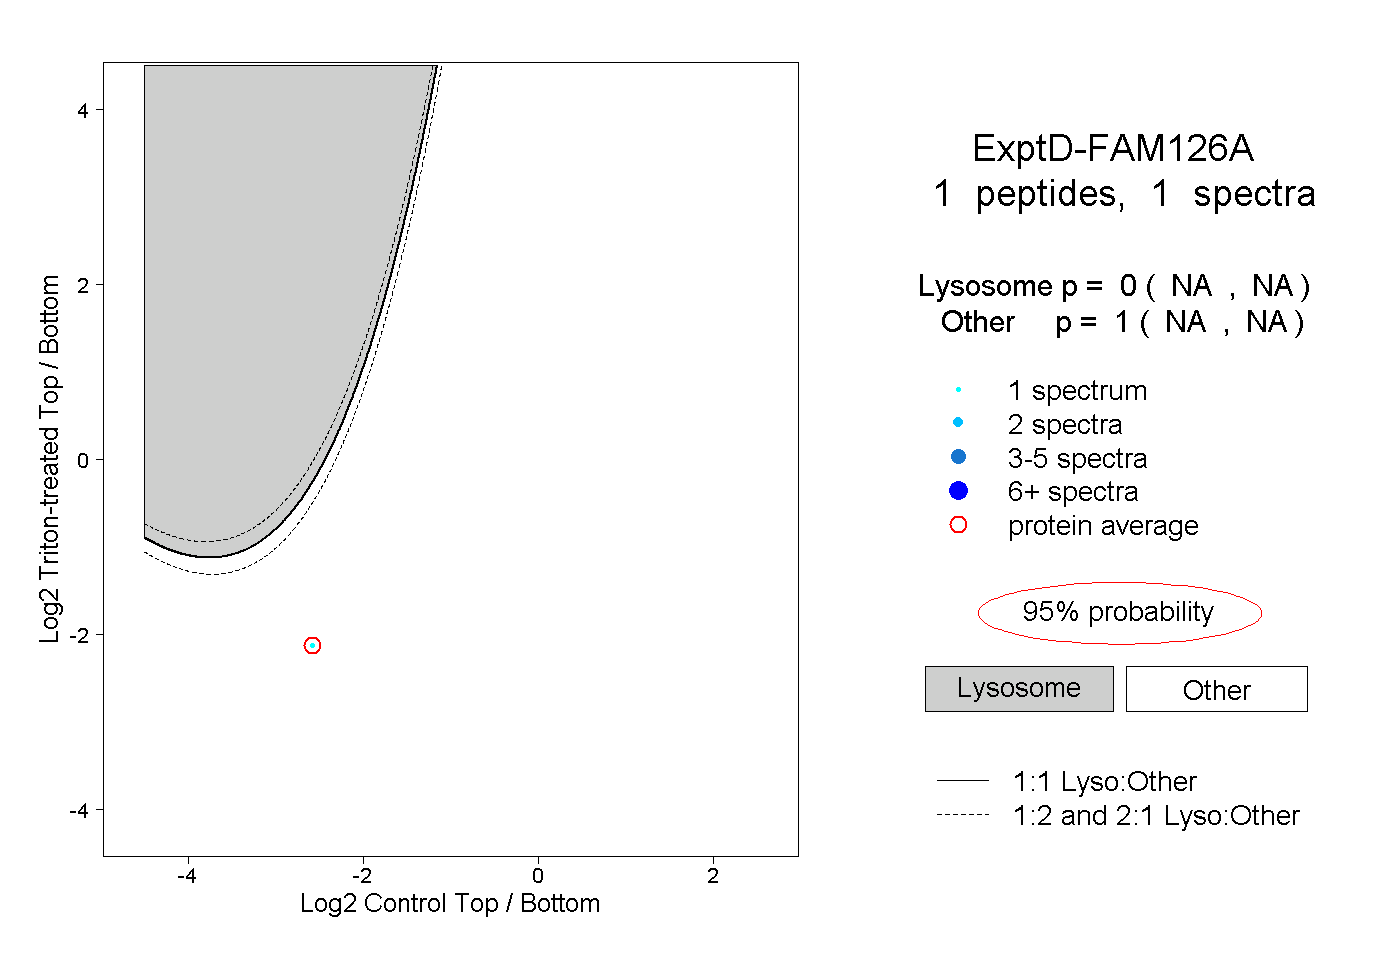
NA | NA
NA | NA