 2
2peptides
spectra
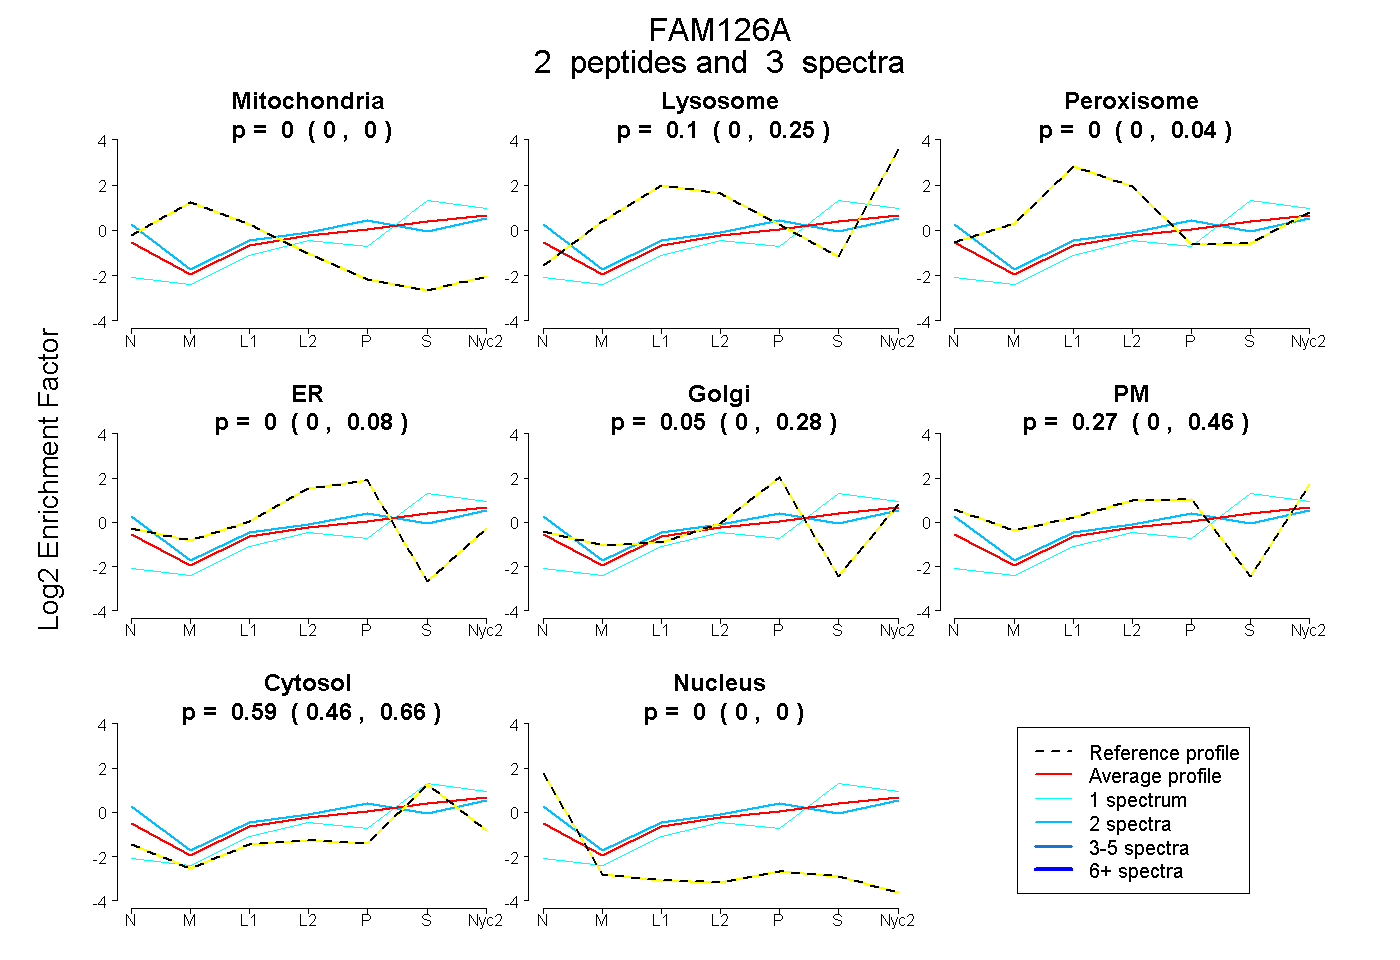
0.000 | 0.000
0.000 | 0.248
0.000 | 0.043
0.000 | 0.076
0.000 | 0.282
0.000 | 0.457
0.462 | 0.661
0.000 | 0.000
| Plot | Mito | Lyso | Perox | ER | Golgi | PM | Cytosol | Nucleus | |||||
| Expt A |
2 peptides |
3 spectra |
|
0.000 0.000 | 0.000 |
0.098 0.000 | 0.248 |
0.000 0.000 | 0.043 |
0.000 0.000 | 0.076 |
0.046 0.000 | 0.282 |
0.270 0.000 | 0.457 |
0.586 0.462 | 0.661 |
0.000 0.000 | 0.000 |
| 2 spectra, AQLELYPEPLLVANAIK | 0.000 | 0.000 | 0.000 | 0.000 | 0.000 | 0.521 | 0.479 | 0.000 | ||
| 1 spectrum, CEQGAR | 0.000 | 0.228 | 0.000 | 0.000 | 0.000 | 0.000 | 0.772 | 0.000 |
| Plot | Lyso | Other | |||||||||||
| Expt C |
3 peptides |
6 spectra |
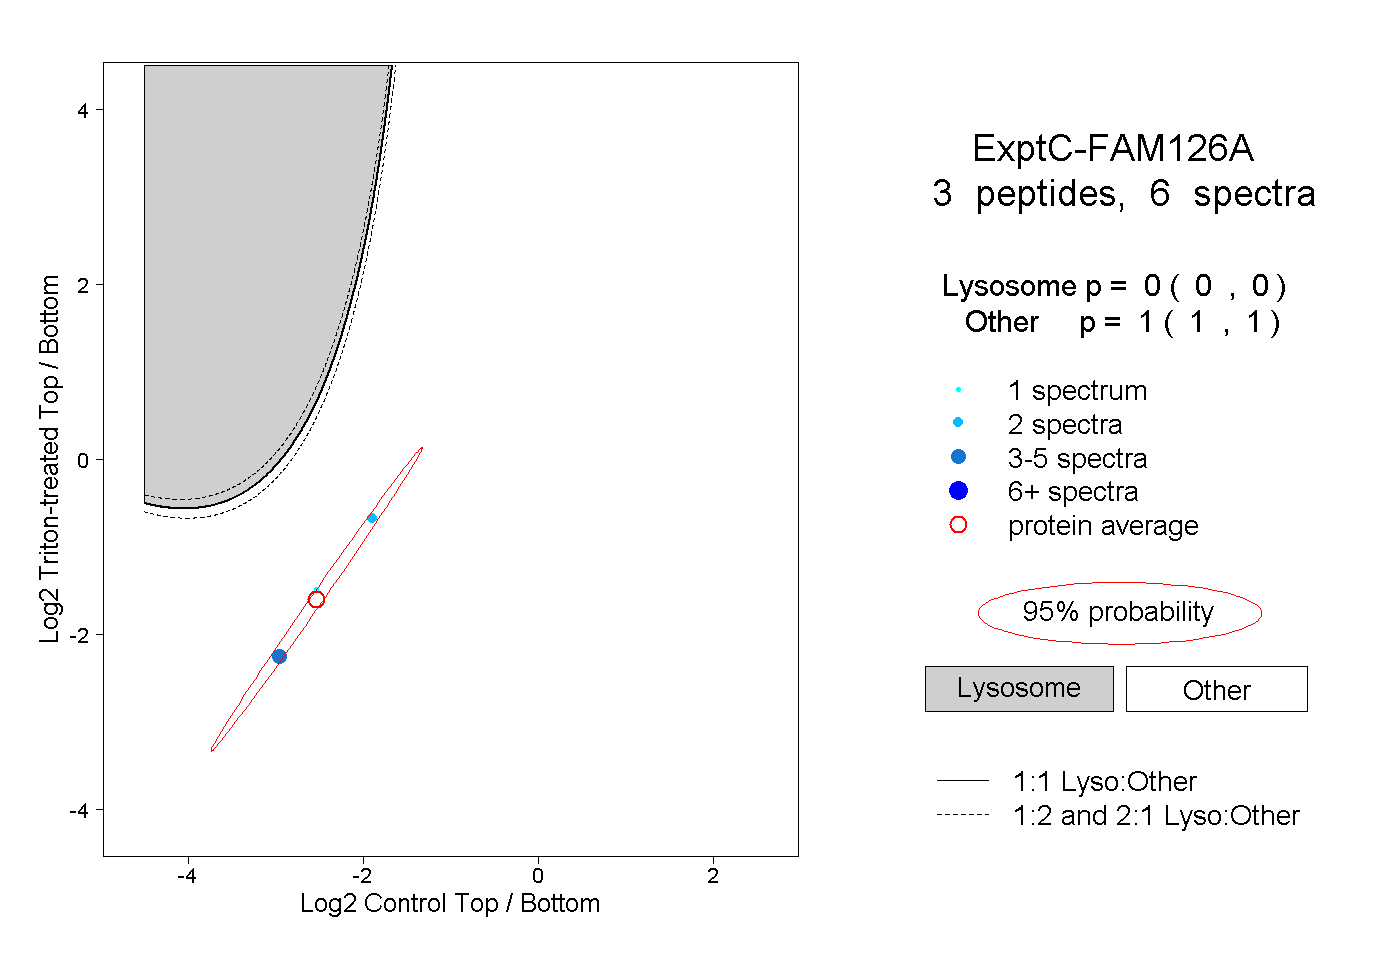 |
0.000 0.000 | 0.000 |
1.000 1.000 | 1.000 |
||||||||
| Plot | Lyso | Other | |||||||||||
| Expt D |
1 peptide |
1 spectrum |
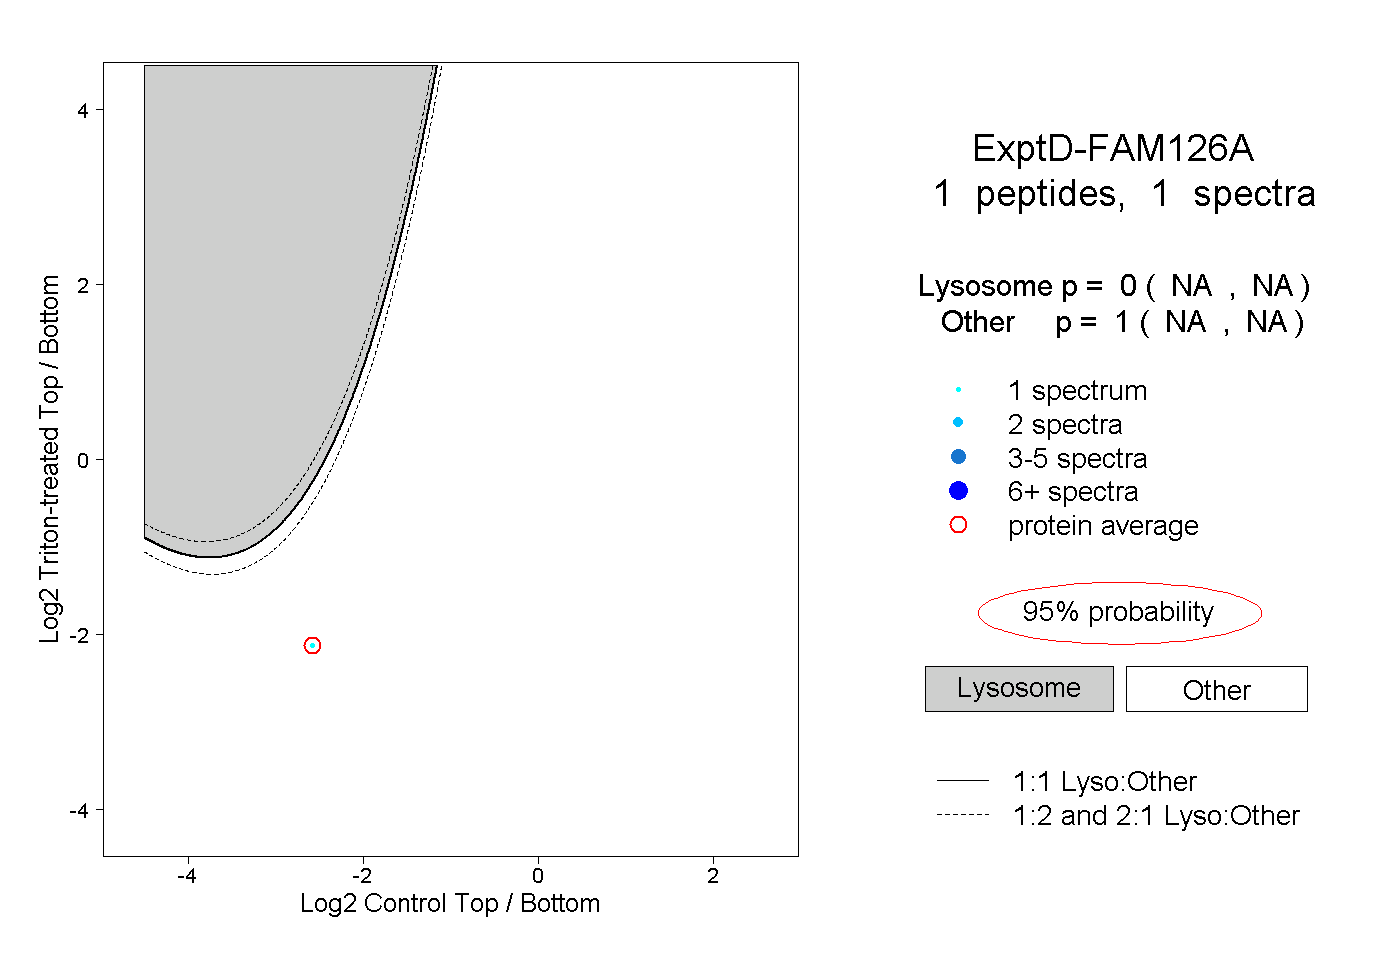 |
0.000 NA | NA |
1.000 NA | NA |