 10
10peptides
spectra
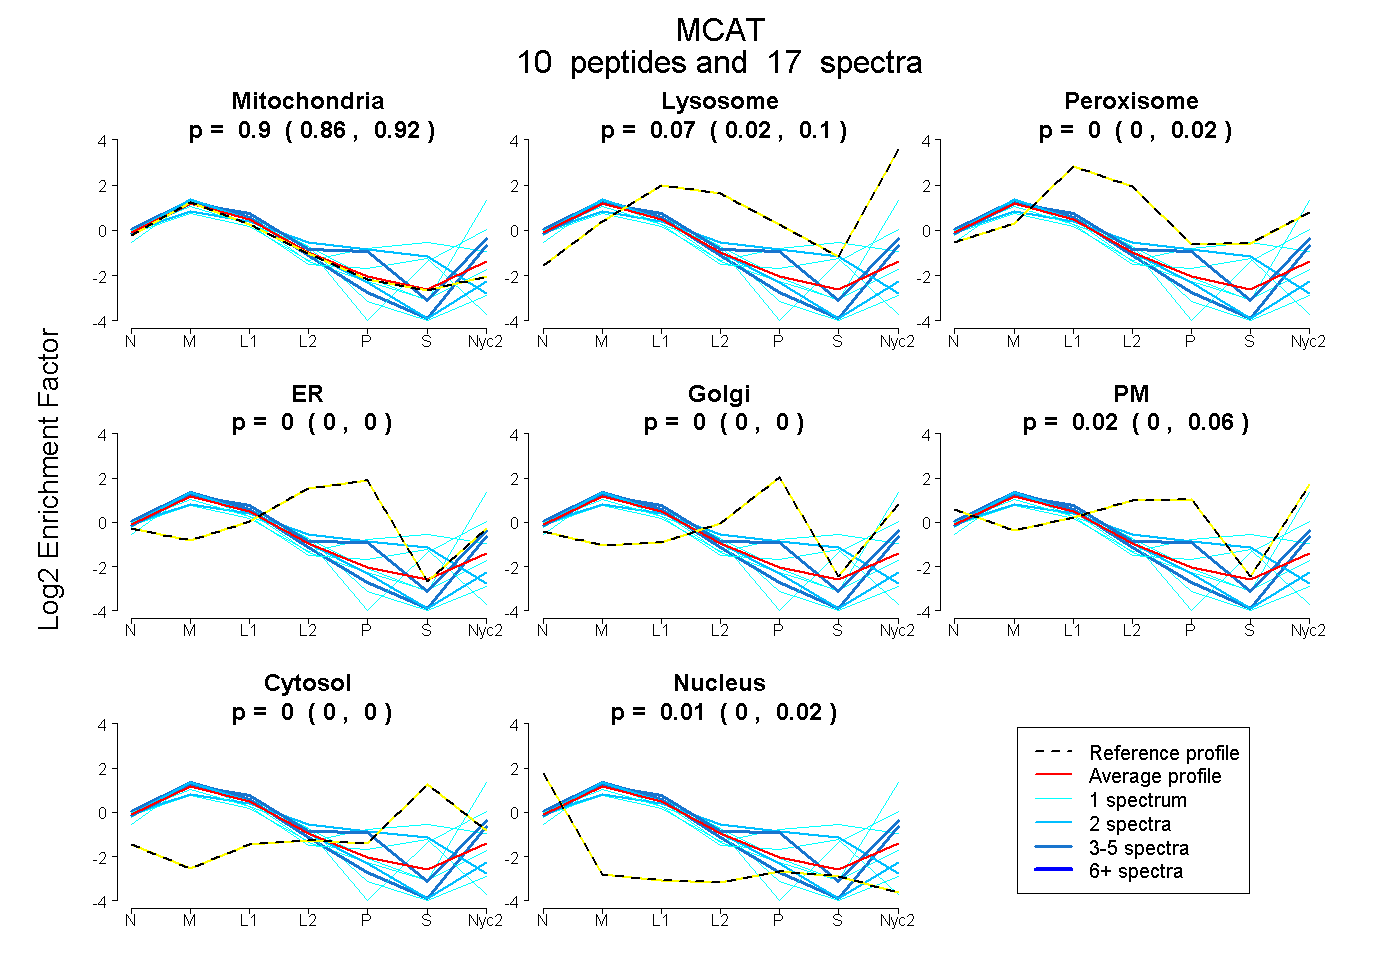
0.863 | 0.923
0.021 | 0.104
0.000 | 0.024
0.000 | 0.000
0.000 | 0.000
0.000 | 0.062
0.000 | 0.000
0.000 | 0.020
3peptides
spectra
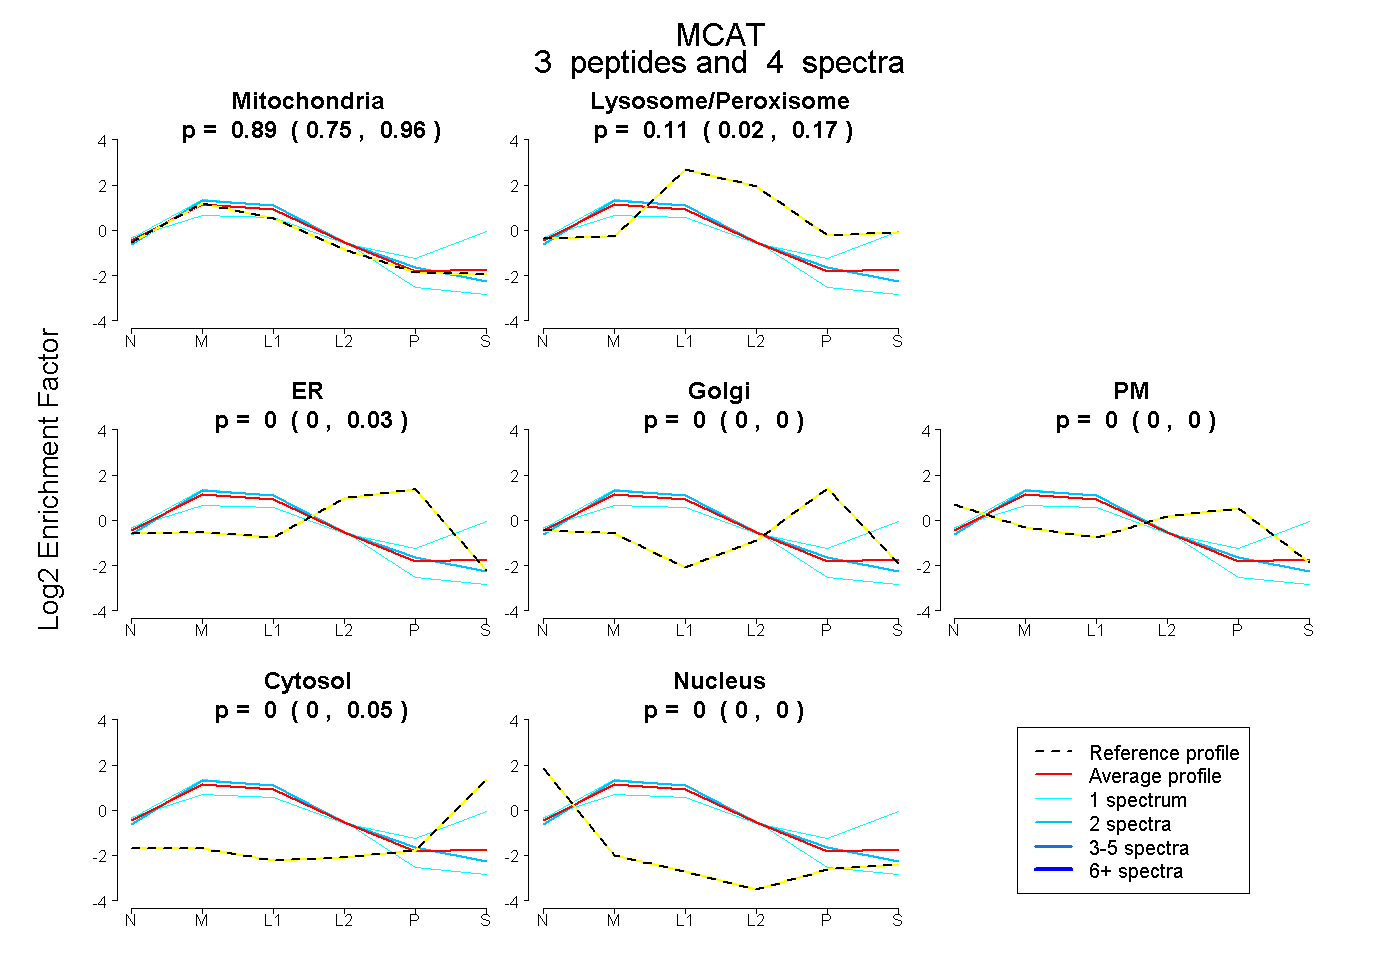
0.748 | 0.962
0.021 | 0.173
0.000 | 0.028
0.000 | 0.000
0.000 | 0.000
0.000 | 0.053
0.000 | 0.000
9peptides
spectra
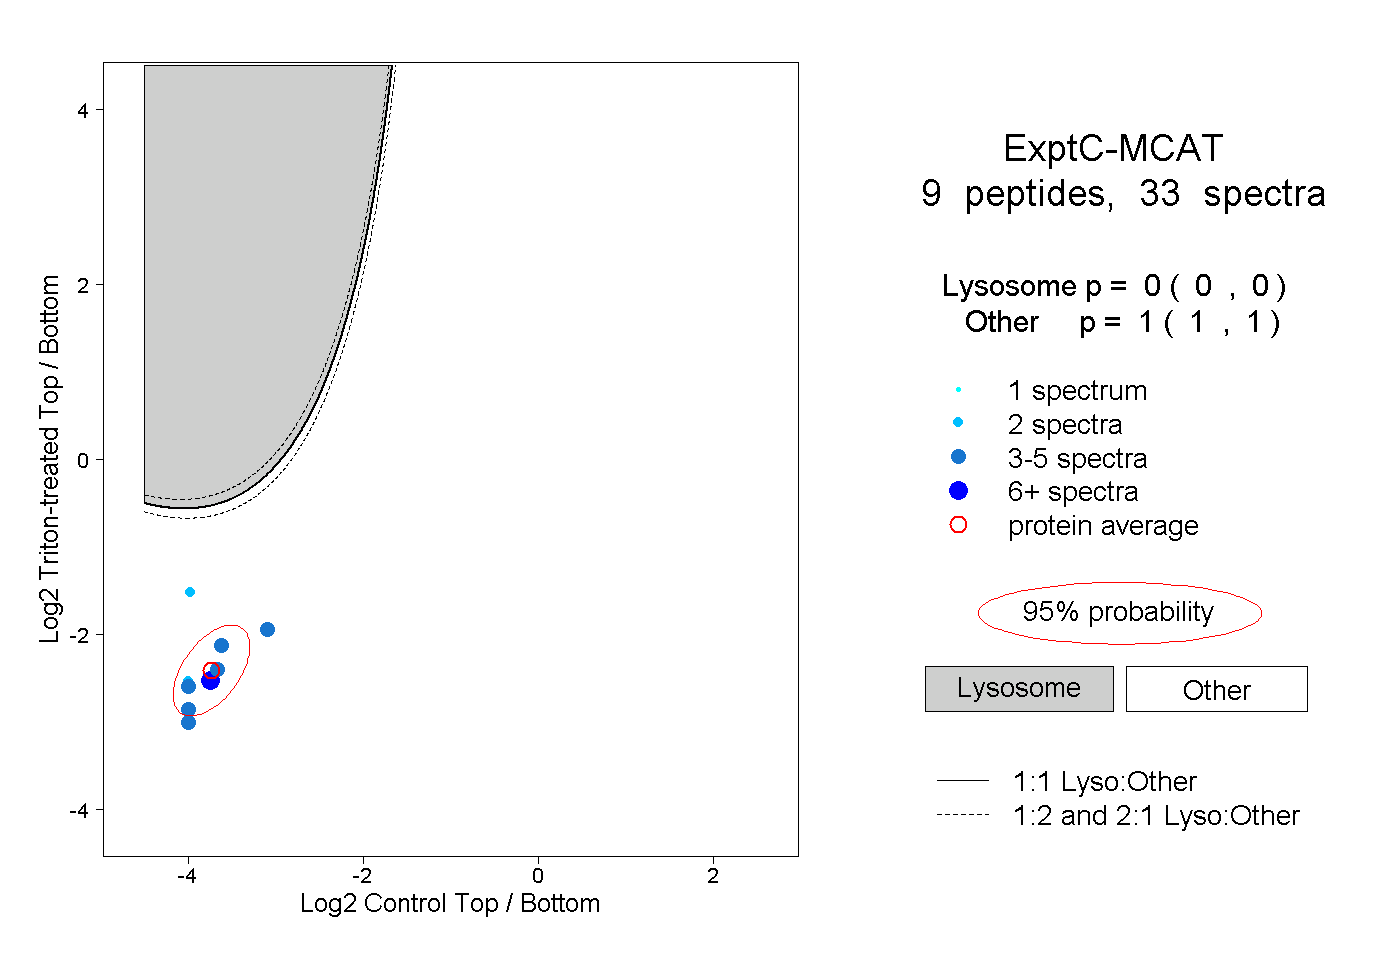
0.000 | 0.000
1.000 | 1.000
3peptides
spectra
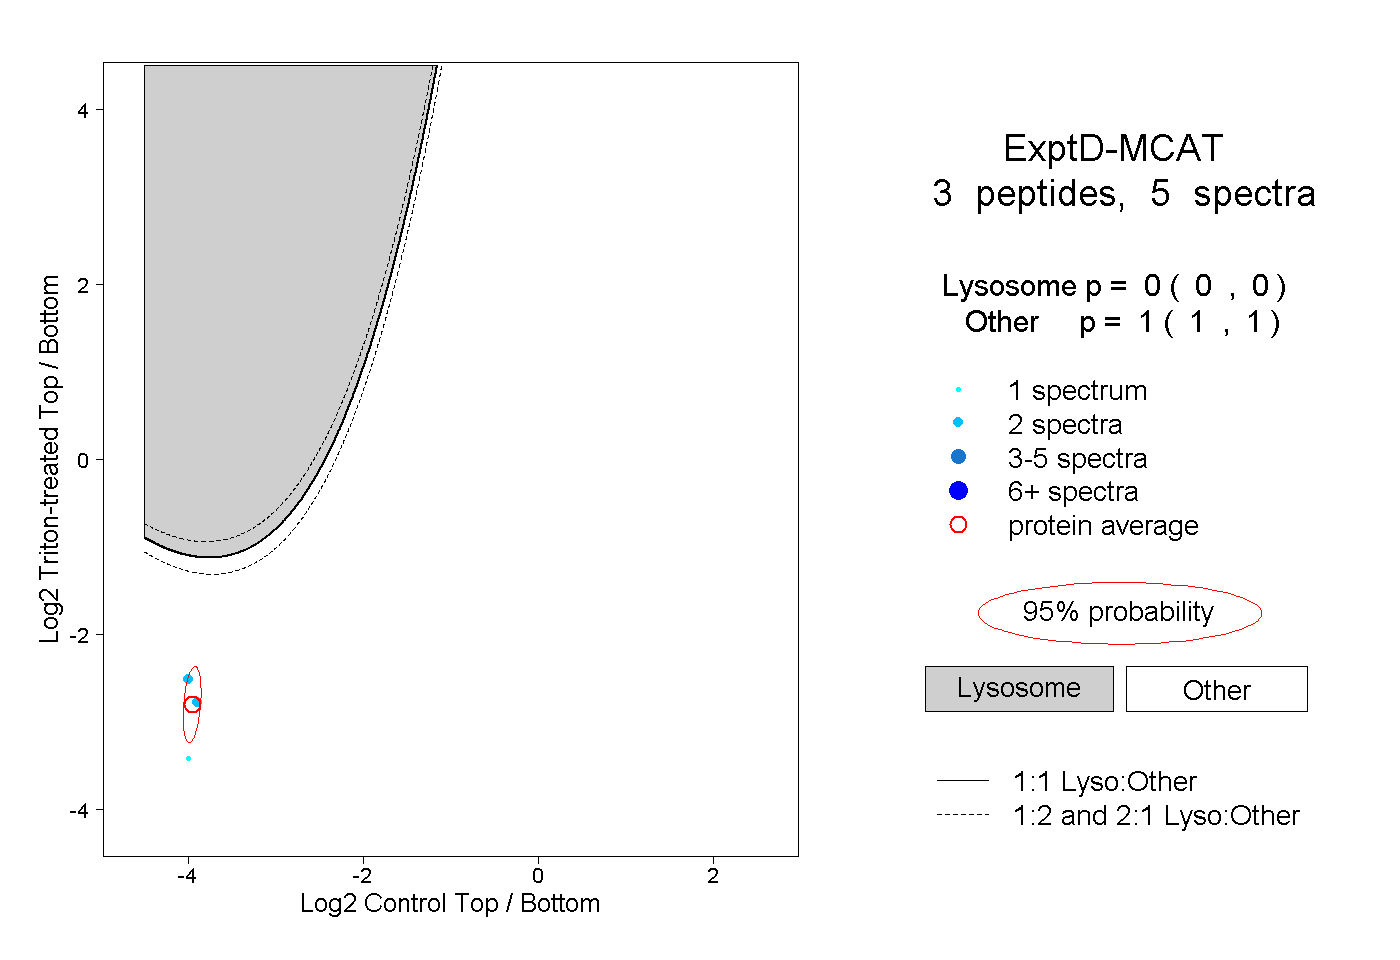
0.000 | 0.000
1.000 | 1.000