 10
10peptides
spectra
0.863 | 0.923
0.021 | 0.104
0.000 | 0.024
0.000 | 0.000
0.000 | 0.000
0.000 | 0.062
0.000 | 0.000
0.000 | 0.020
| Plot | Mito | Lyso | Perox | ER | Golgi | PM | Cytosol | Nucleus | |||||
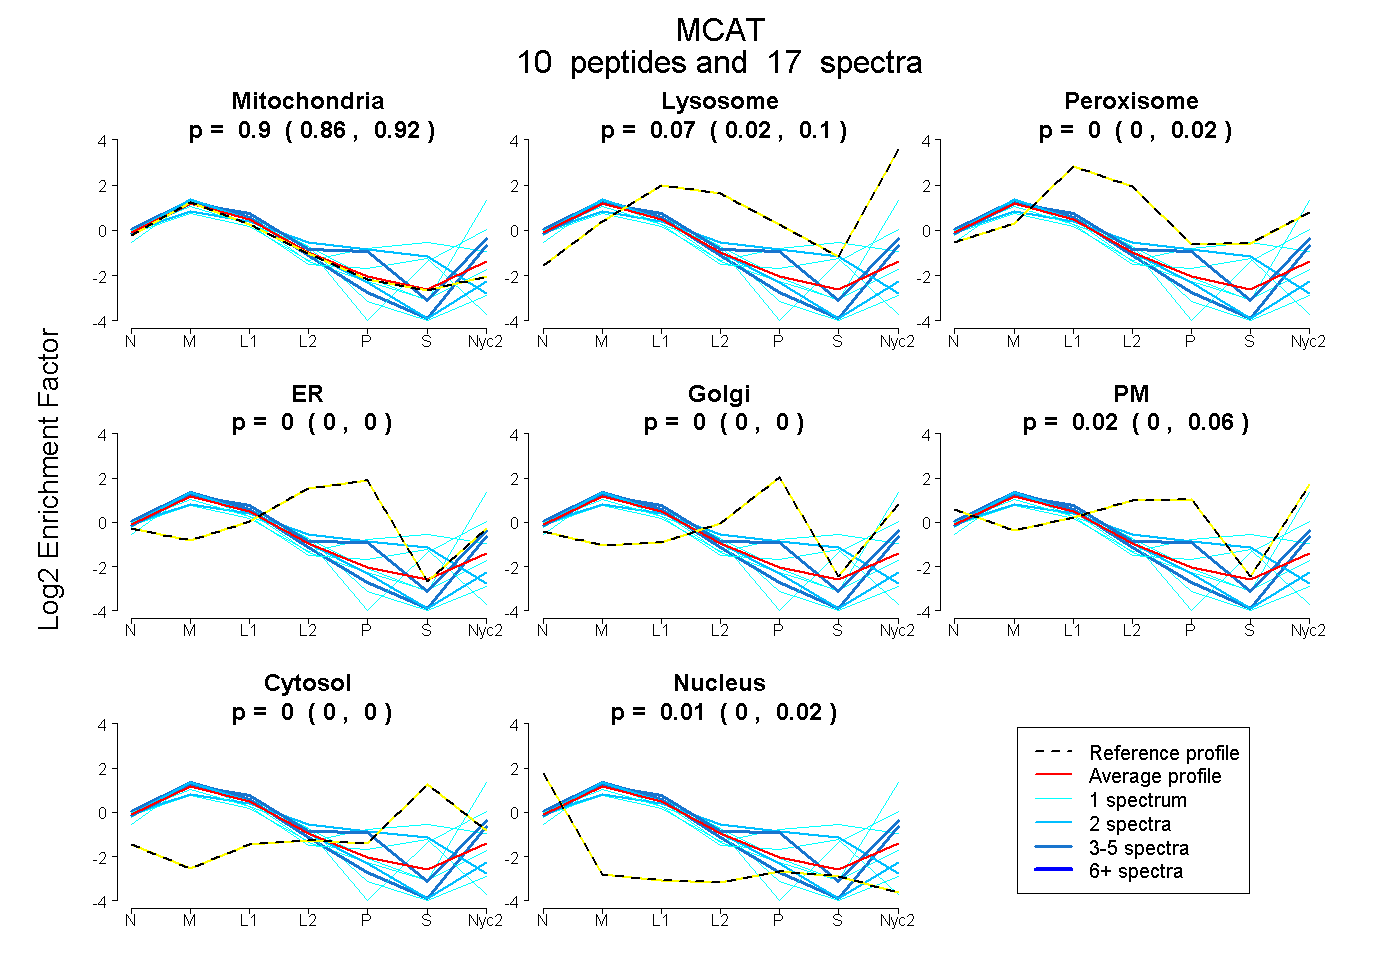
| Expt A |
10 peptides |
17 spectra |
|
0.899 0.863 | 0.923 |
0.070 0.021 | 0.104 |
0.000 0.000 | 0.024 |
0.000 0.000 | 0.000 |
0.000 0.000 | 0.000 |
0.024 0.000 | 0.062 |
0.000 0.000 | 0.000 |
0.007 0.000 | 0.020 |
| 1 spectrum, SYSHVDVMQTLLDPDH | 0.828 | 0.000 | 0.000 | 0.000 | 0.000 | 0.000 | 0.094 | 0.078 | ||
| 1 spectrum, DSSVTEEGVQEAVAR | 0.986 | 0.000 | 0.000 | 0.000 | 0.000 | 0.000 | 0.000 | 0.014 | ||
| 1 spectrum, EPPPDAVDVAGLLR | 0.990 | 0.000 | 0.000 | 0.000 | 0.000 | 0.009 | 0.000 | 0.001 | ||
| 1 spectrum, GMEFPSTFEVGPGQQLGSILK | 0.512 | 0.017 | 0.122 | 0.000 | 0.091 | 0.000 | 0.258 | 0.000 | ||
| 1 spectrum, LLGQQVVSPVK | 0.574 | 0.372 | 0.000 | 0.000 | 0.000 | 0.016 | 0.000 | 0.038 | ||
| 1 spectrum, QLYEAAHR | 0.742 | 0.175 | 0.000 | 0.000 | 0.000 | 0.000 | 0.083 | 0.000 | ||
| 2 spectra, VLGYDLLELCLR | 1.000 | 0.000 | 0.000 | 0.000 | 0.000 | 0.000 | 0.000 | 0.000 | ||
| 2 spectra, QSNFSFACLEAQEHCR | 0.701 | 0.000 | 0.038 | 0.116 | 0.000 | 0.000 | 0.145 | 0.000 | ||
| 3 spectra, VISGHLEALQFLR | 0.672 | 0.090 | 0.000 | 0.000 | 0.000 | 0.239 | 0.000 | 0.000 | ||
| 4 spectra, GPQEDLDR | 0.911 | 0.070 | 0.000 | 0.000 | 0.000 | 0.018 | 0.000 | 0.000 |
| Plot | Mito | Lyso or Perox | ER | Golgi | PM | Cytosol | Nucleus | ||||||
| Expt B |
3 peptides |
4 spectra |
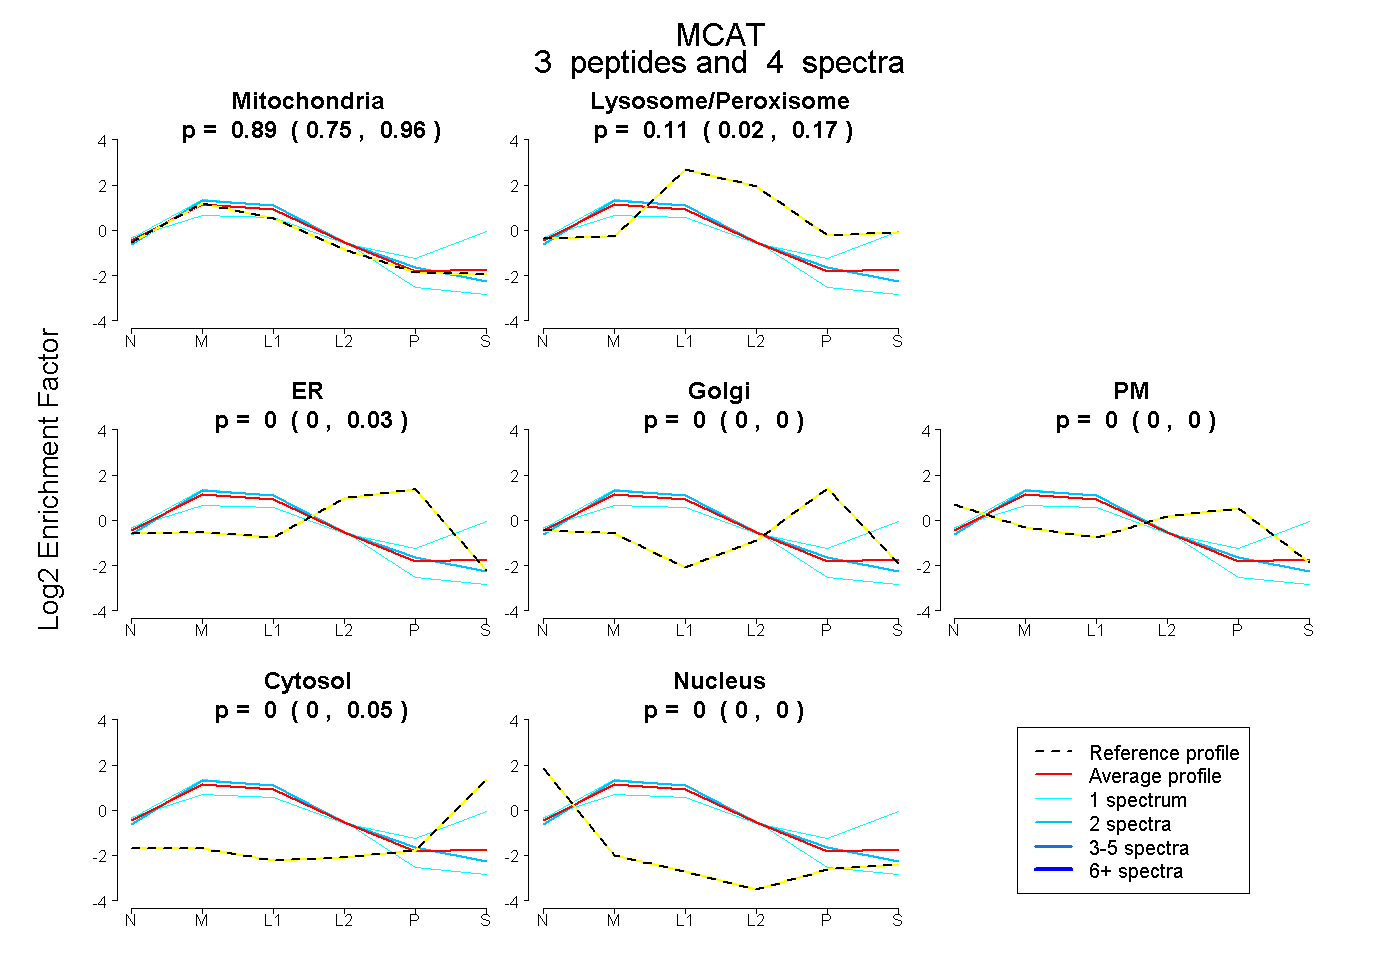 |
0.891 0.748 | 0.962 |
0.109 0.021 | 0.173 |
0.000 0.000 | 0.028 |
0.000 0.000 | 0.000 |
0.000 0.000 | 0.000 |
0.000 0.000 | 0.053 |
0.000 0.000 | 0.000 |
|||
| Plot | Lyso | Other | |||||||||||
| Expt C |
9 peptides |
33 spectra |
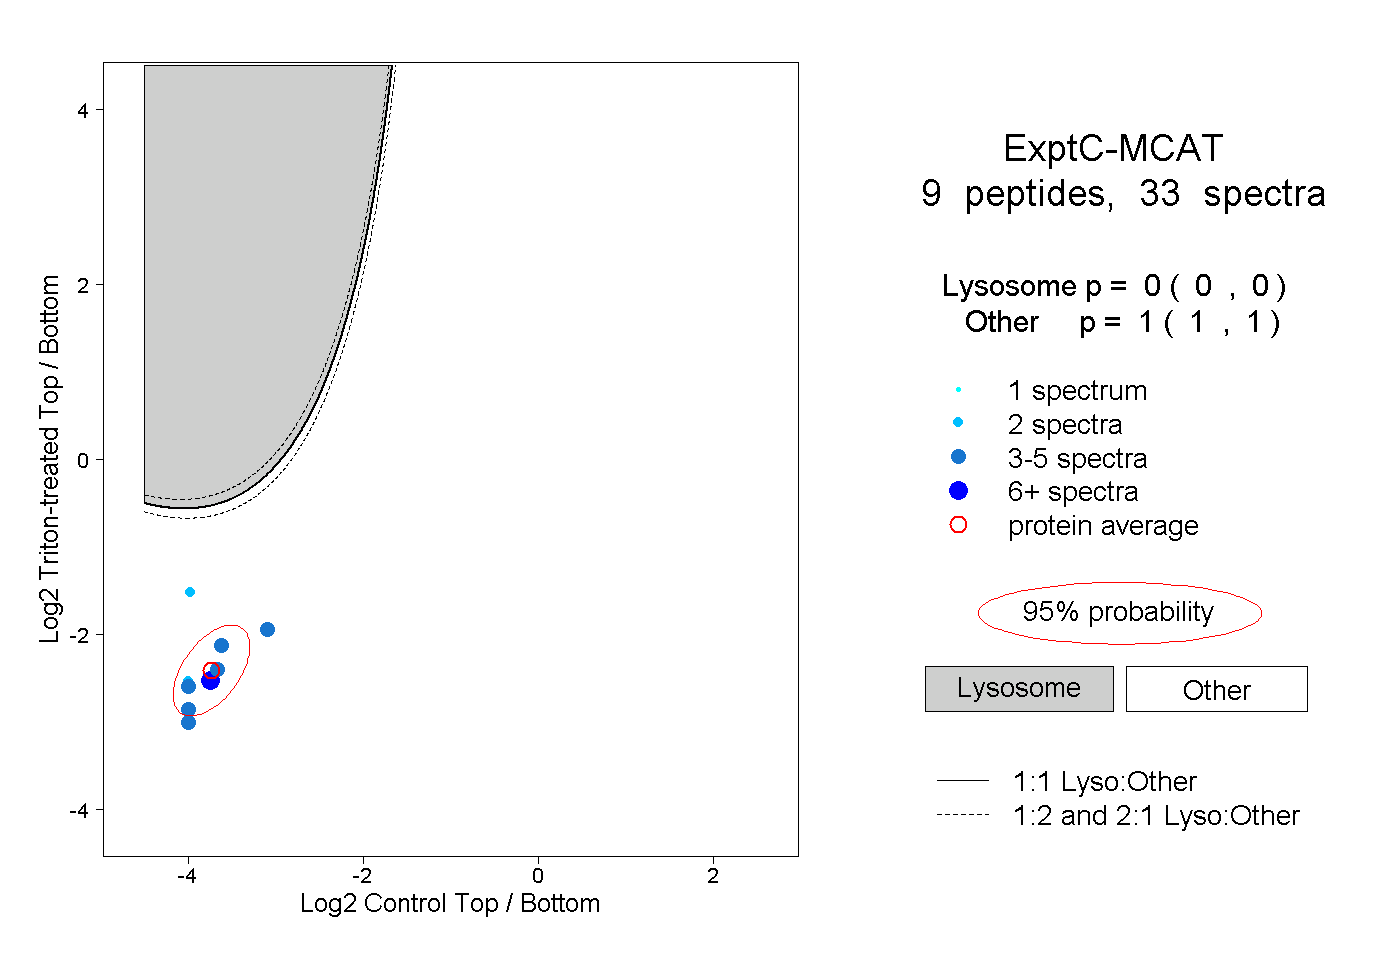 |
0.000 0.000 | 0.000 |
1.000 1.000 | 1.000 |
||||||||
| Plot | Lyso | Other | |||||||||||
| Expt D |
3 peptides |
5 spectra |
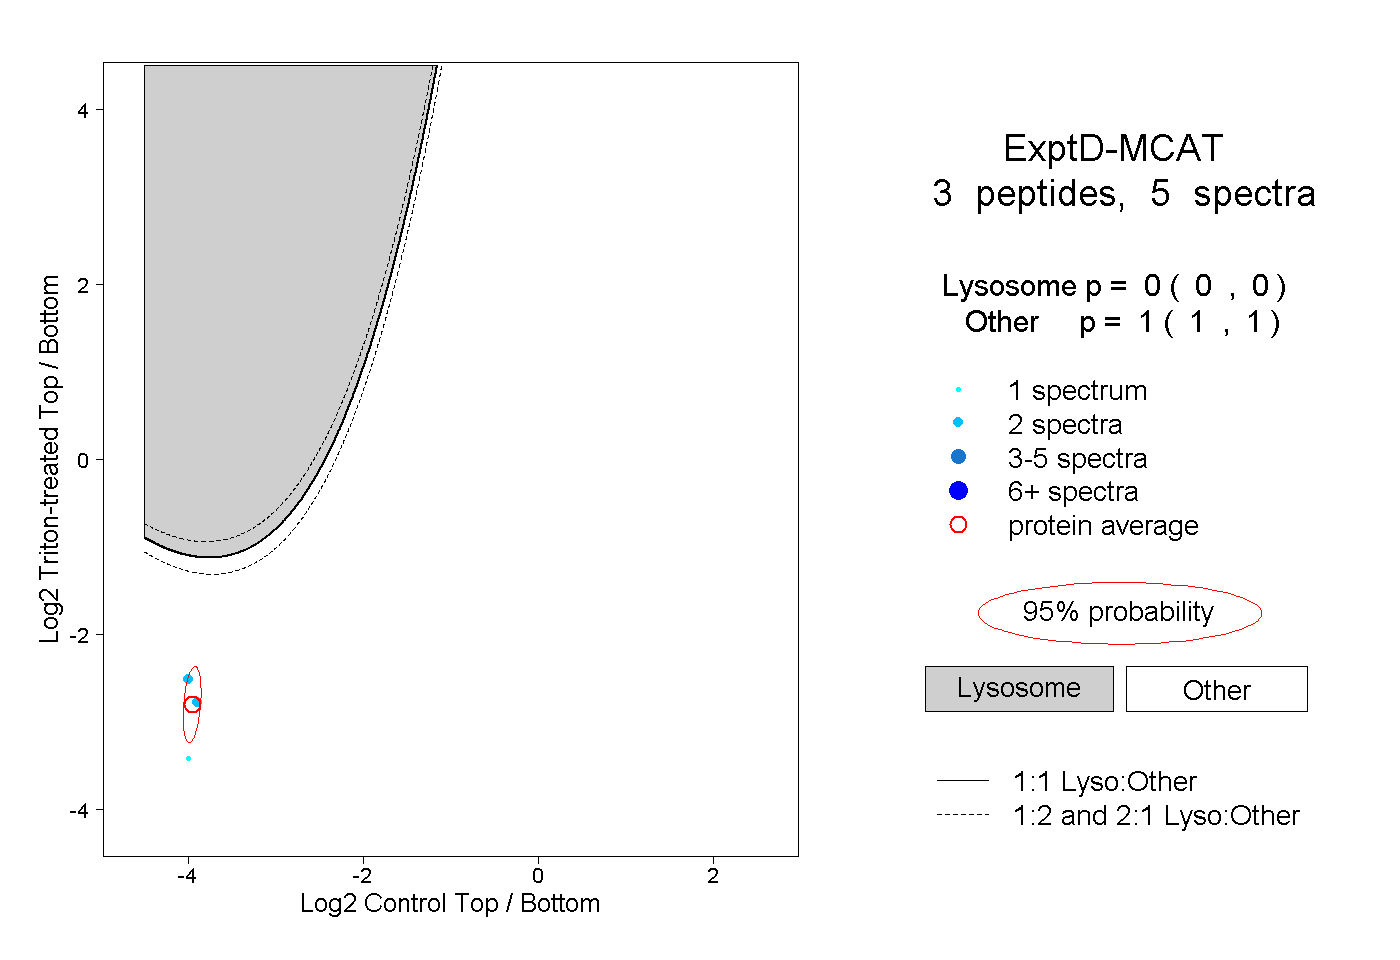 |
0.000 0.000 | 0.000 |
1.000 1.000 | 1.000 |