 10
10peptides
spectra
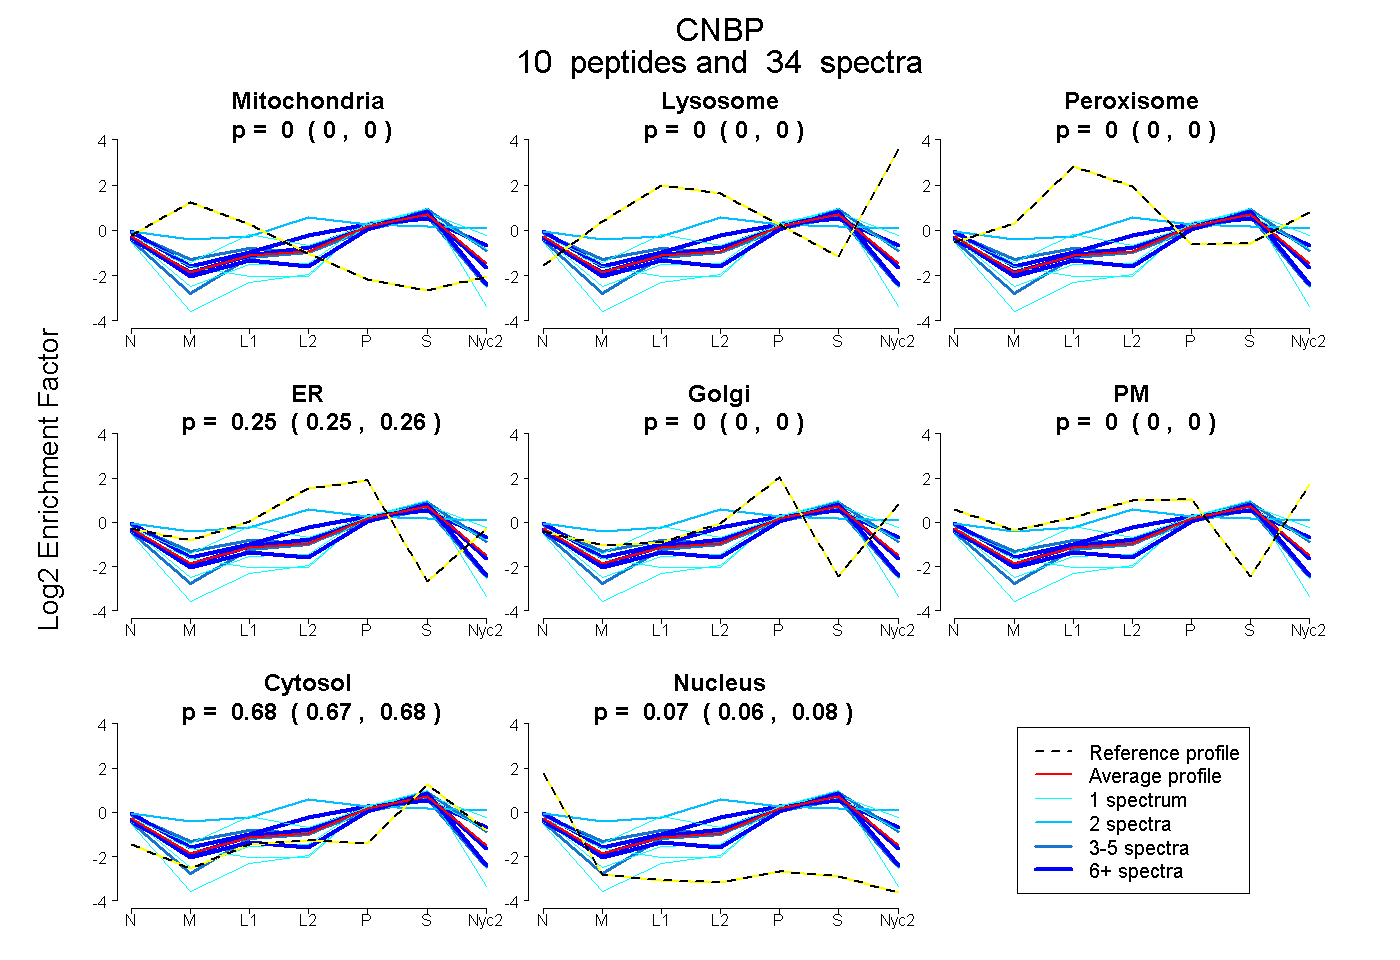
0.000 | 0.000
0.000 | 0.000
0.000 | 0.000
0.246 | 0.261
0.000 | 0.000
0.000 | 0.000
0.669 | 0.682
0.060 | 0.077
4peptides
spectra
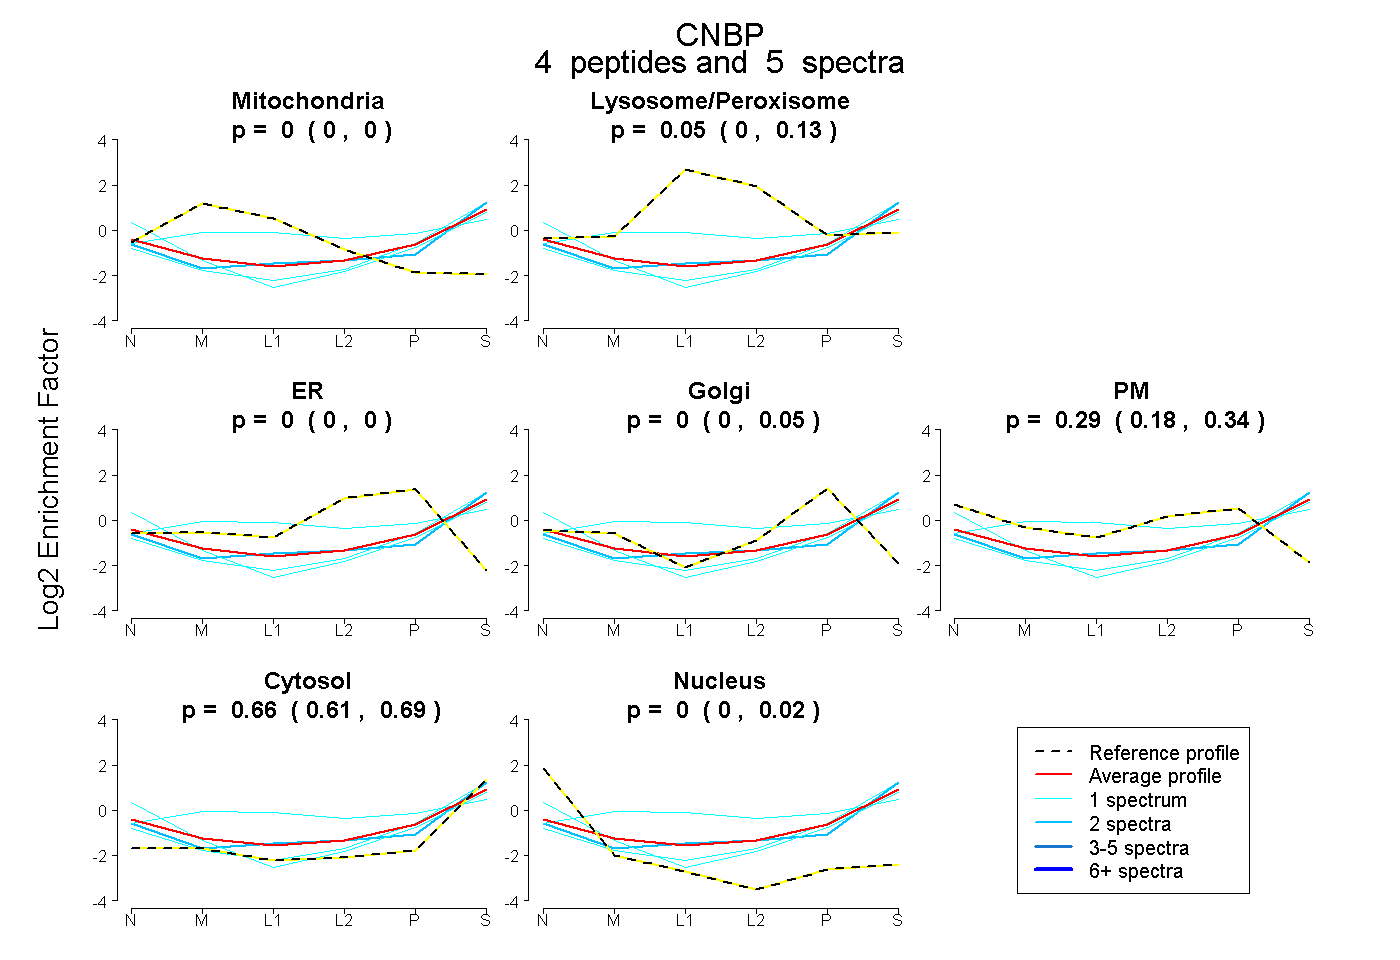
0.000 | 0.000
0.000 | 0.131
0.000 | 0.000
0.000 | 0.046
0.180 | 0.339
0.609 | 0.693
0.000 | 0.023
5peptides
spectra
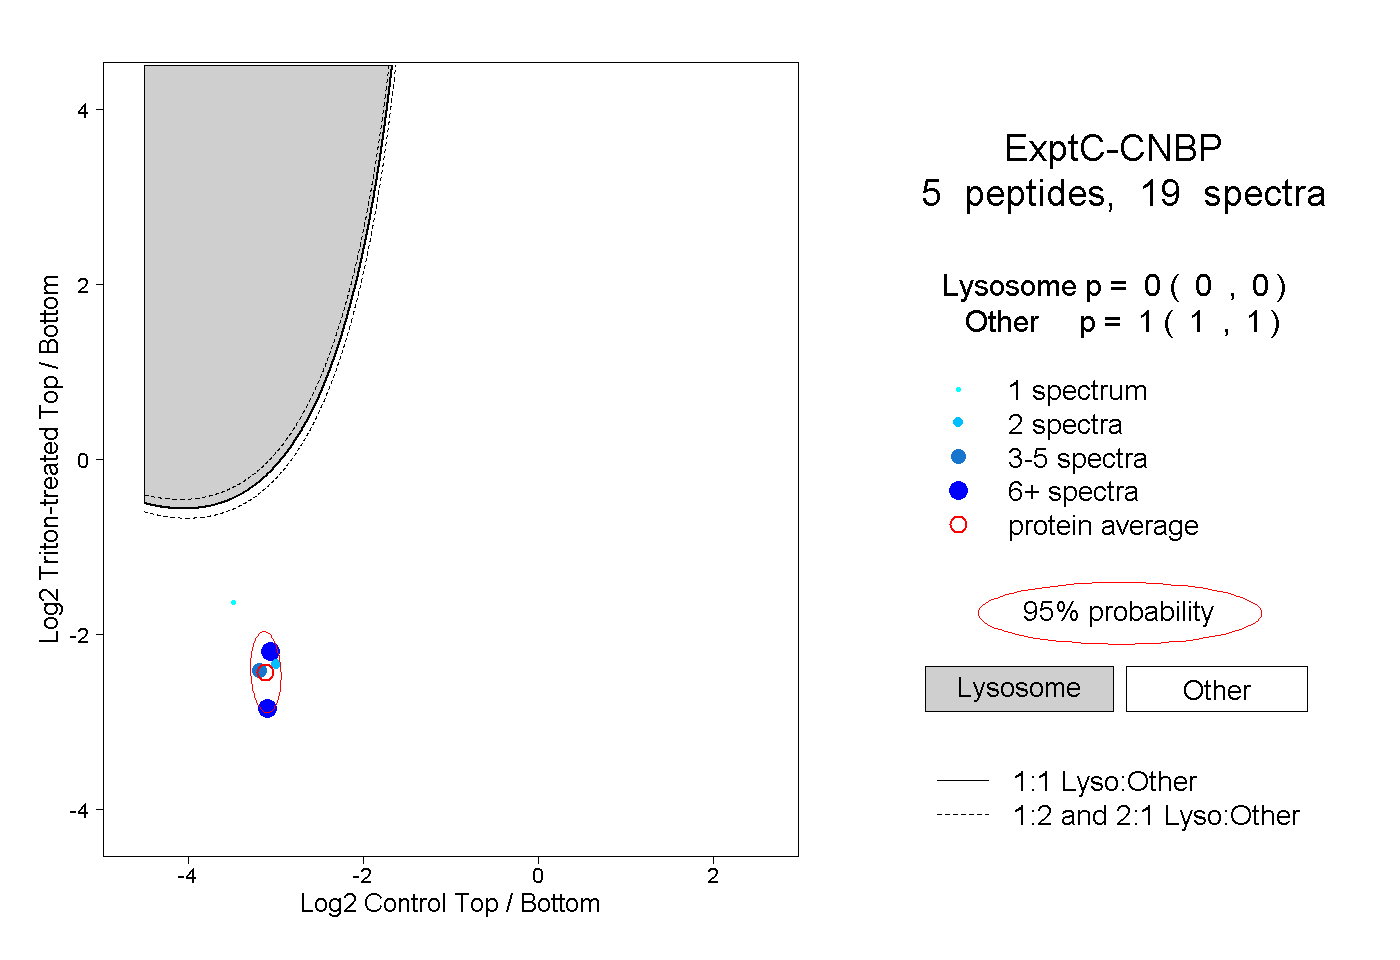
0.000 | 0.000
1.000 | 1.000
1peptide
spectrum
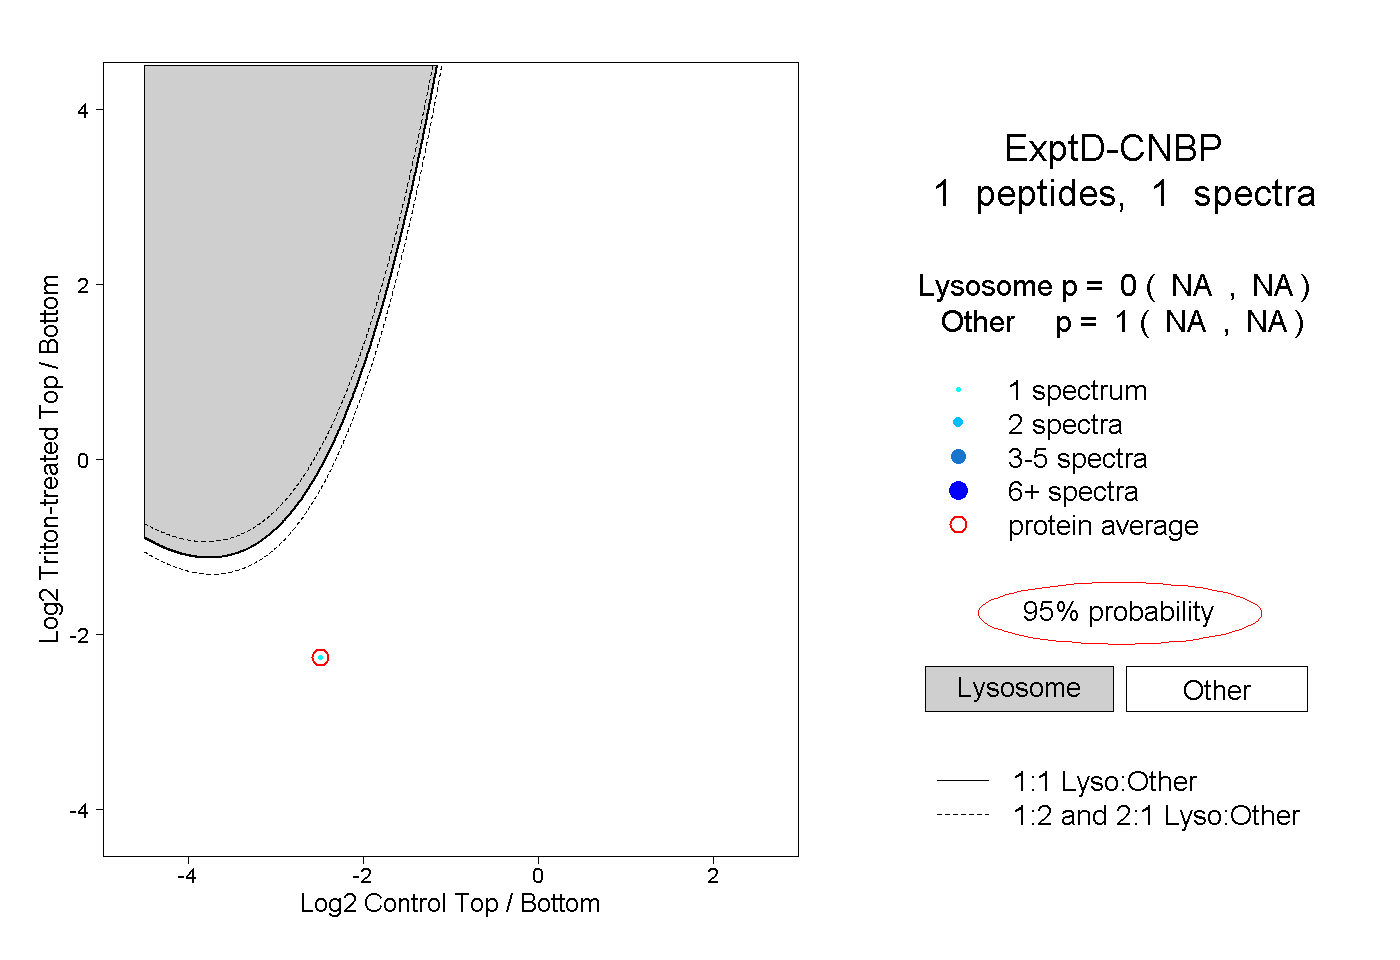
NA | NA
NA | NA