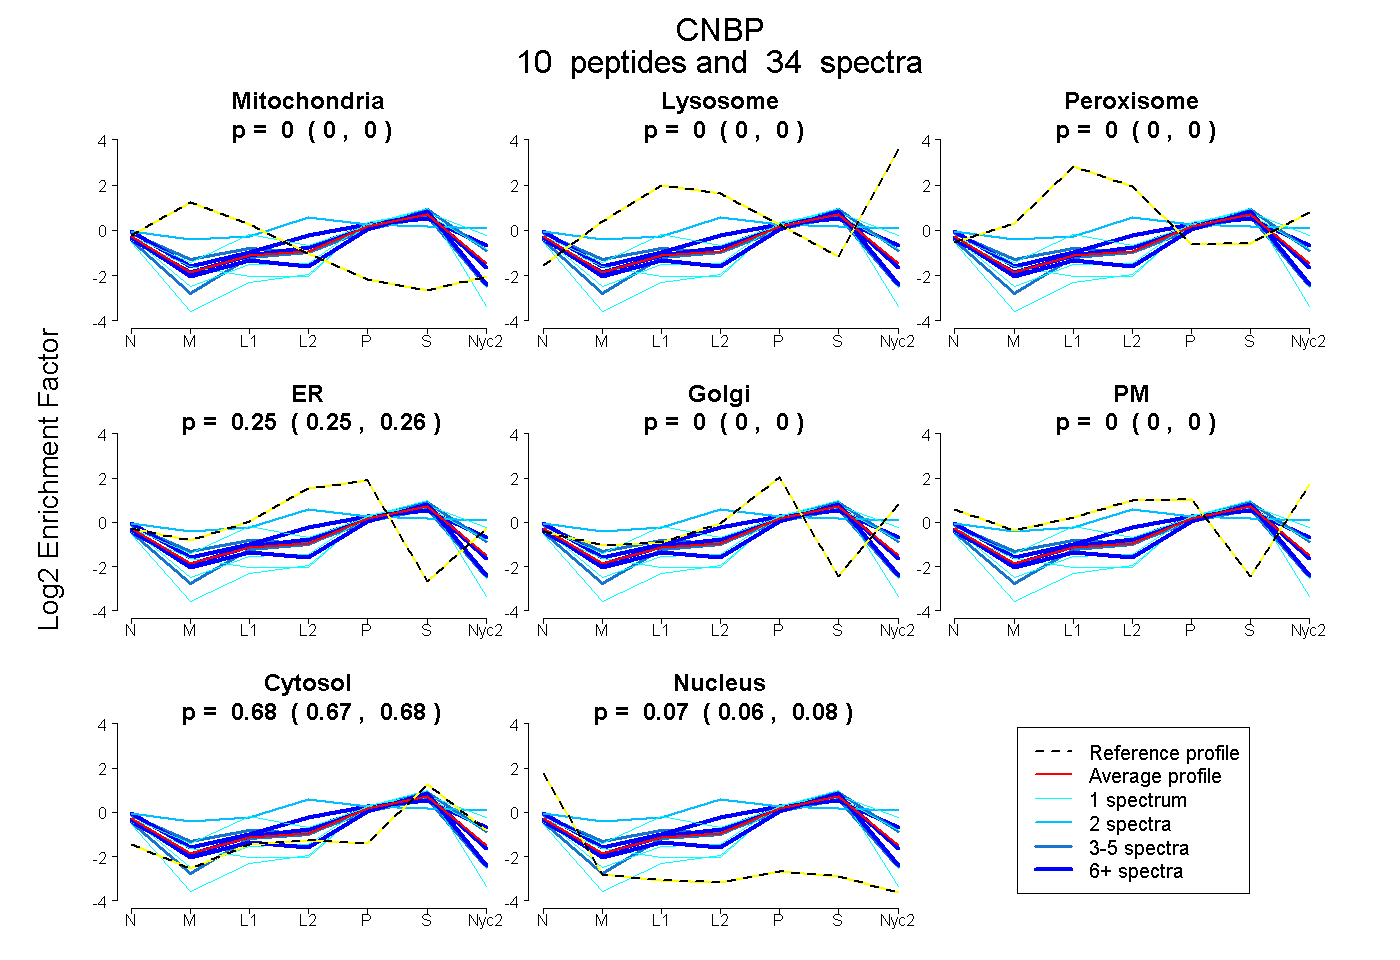
 10
10peptides
spectra
0.000 | 0.000
0.000 | 0.000
0.000 | 0.000
0.246 | 0.261
0.000 | 0.000
0.000 | 0.000
0.669 | 0.682
0.060 | 0.077
| Plot | Mito | Lyso | Perox | ER | Golgi | PM | Cytosol | Nucleus | |||||
| Expt A |
10 peptides |
34 spectra |
|
0.000 0.000 | 0.000 |
0.000 0.000 | 0.000 |
0.000 0.000 | 0.000 |
0.254 0.246 | 0.261 |
0.000 0.000 | 0.000 |
0.000 0.000 | 0.000 |
0.676 0.669 | 0.682 |
0.069 0.060 | 0.077 |
| 1 spectrum, GGHIAK | 0.000 | 0.000 | 0.000 | 0.000 | 0.288 | 0.000 | 0.674 | 0.037 | ||
| 2 spectra, ECTIEATA | 0.000 | 0.000 | 0.224 | 0.121 | 0.000 | 0.266 | 0.389 | 0.000 | ||
| 1 spectrum, EQCCYNCGKPGHLAR | 0.000 | 0.000 | 0.000 | 0.000 | 0.000 | 0.000 | 0.723 | 0.277 | ||
| 6 spectra, CGESGHLAR | 0.000 | 0.000 | 0.000 | 0.271 | 0.000 | 0.105 | 0.624 | 0.000 | ||
| 9 spectra, TSEVNCYR | 0.000 | 0.000 | 0.000 | 0.145 | 0.000 | 0.000 | 0.686 | 0.169 | ||
| 1 spectrum, DCDHADEQK | 0.000 | 0.000 | 0.000 | 0.151 | 0.000 | 0.000 | 0.675 | 0.175 | ||
| 1 spectrum, GFQFVSSSLPDICYR | 0.000 | 0.000 | 0.157 | 0.159 | 0.078 | 0.000 | 0.596 | 0.009 | ||
| 3 spectra, CGESGHLAK | 0.109 | 0.000 | 0.000 | 0.211 | 0.000 | 0.000 | 0.579 | 0.101 | ||
| 4 spectra, CGETGHVAINCSK | 0.000 | 0.000 | 0.000 | 0.067 | 0.160 | 0.000 | 0.761 | 0.011 | ||
| 6 spectra, CYSCGEFGHIQK | 0.000 | 0.000 | 0.000 | 0.260 | 0.000 | 0.000 | 0.687 | 0.053 |
| Plot | Mito | Lyso or Perox | ER | Golgi | PM | Cytosol | Nucleus | ||||||
| Expt B |
4 peptides |
5 spectra |
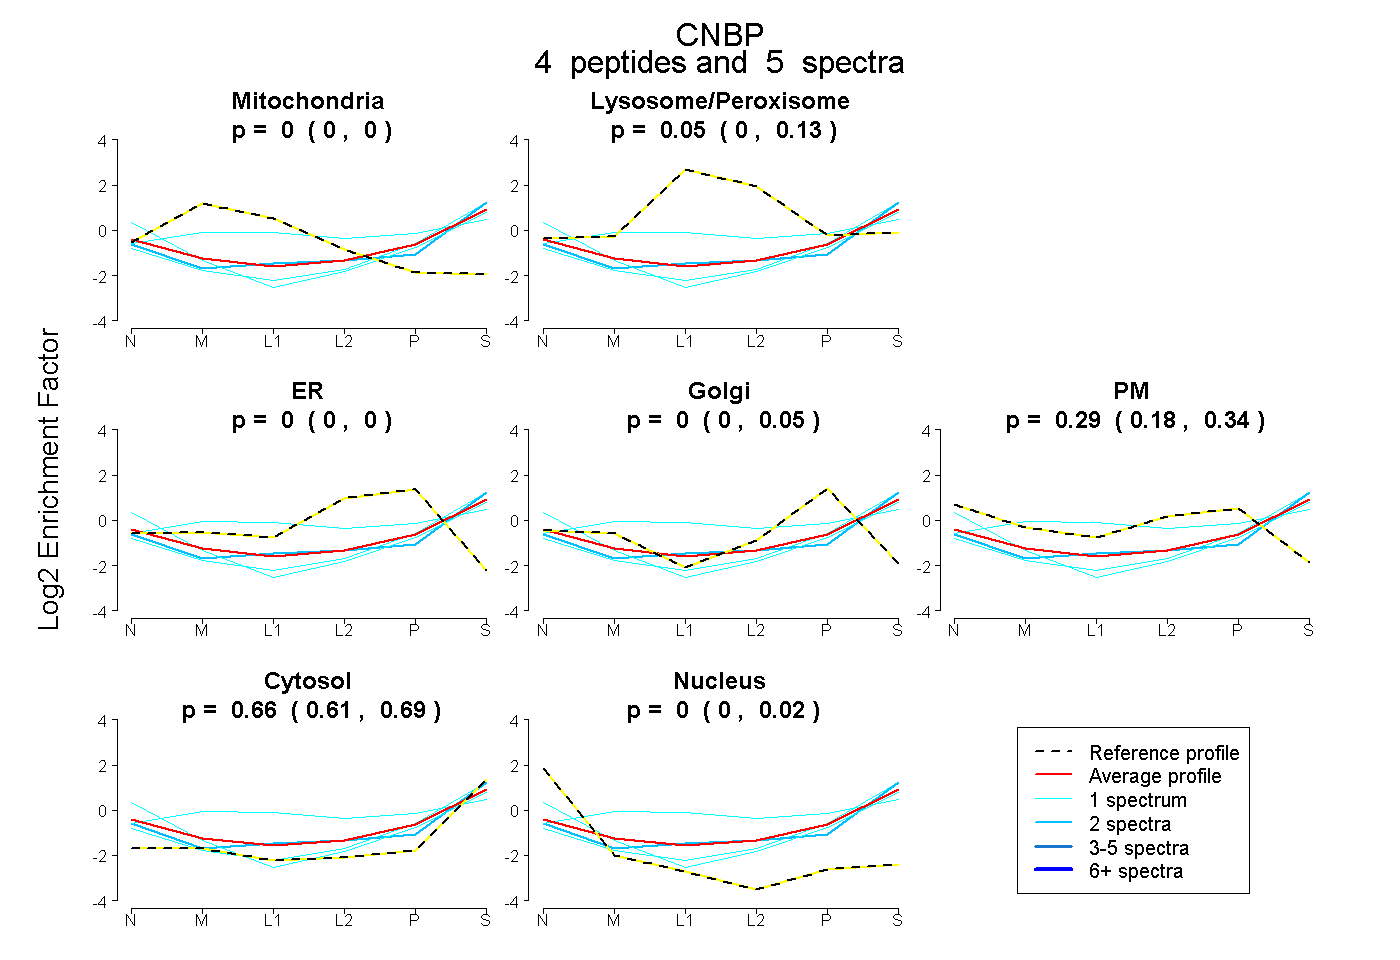 |
0.000 0.000 | 0.000 |
0.048 0.000 | 0.131 |
0.000 0.000 | 0.000 |
0.000 0.000 | 0.046 |
0.292 0.180 | 0.339 |
0.659 0.609 | 0.693 |
0.000 0.000 | 0.023 |
|||
| Plot | Lyso | Other | |||||||||||
| Expt C |
5 peptides |
19 spectra |
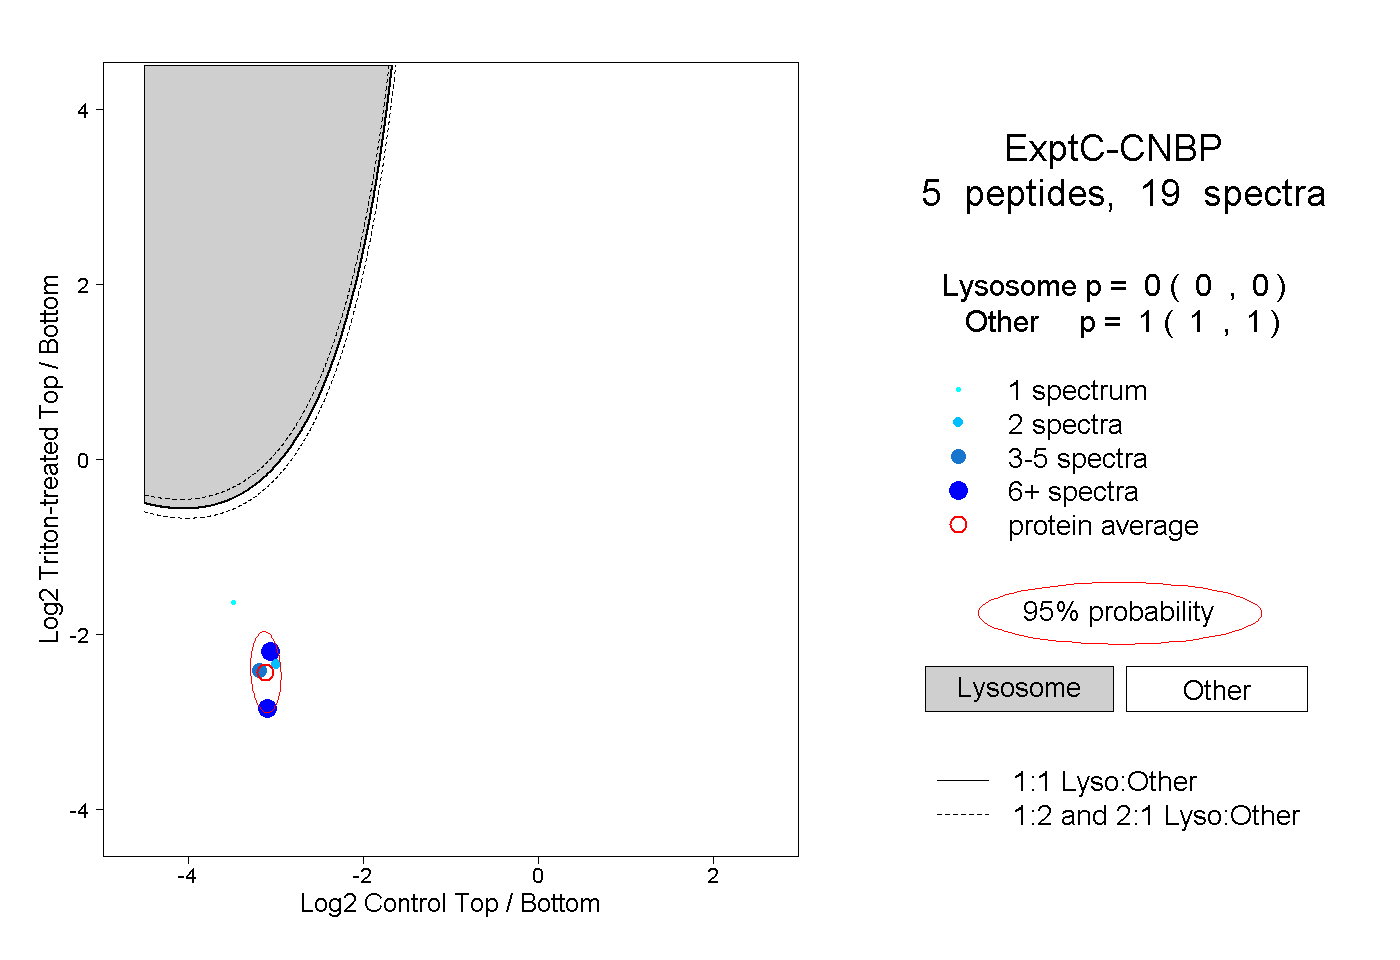 |
0.000 0.000 | 0.000 |
1.000 1.000 | 1.000 |
||||||||
| Plot | Lyso | Other | |||||||||||
| Expt D |
1 peptide |
1 spectrum |
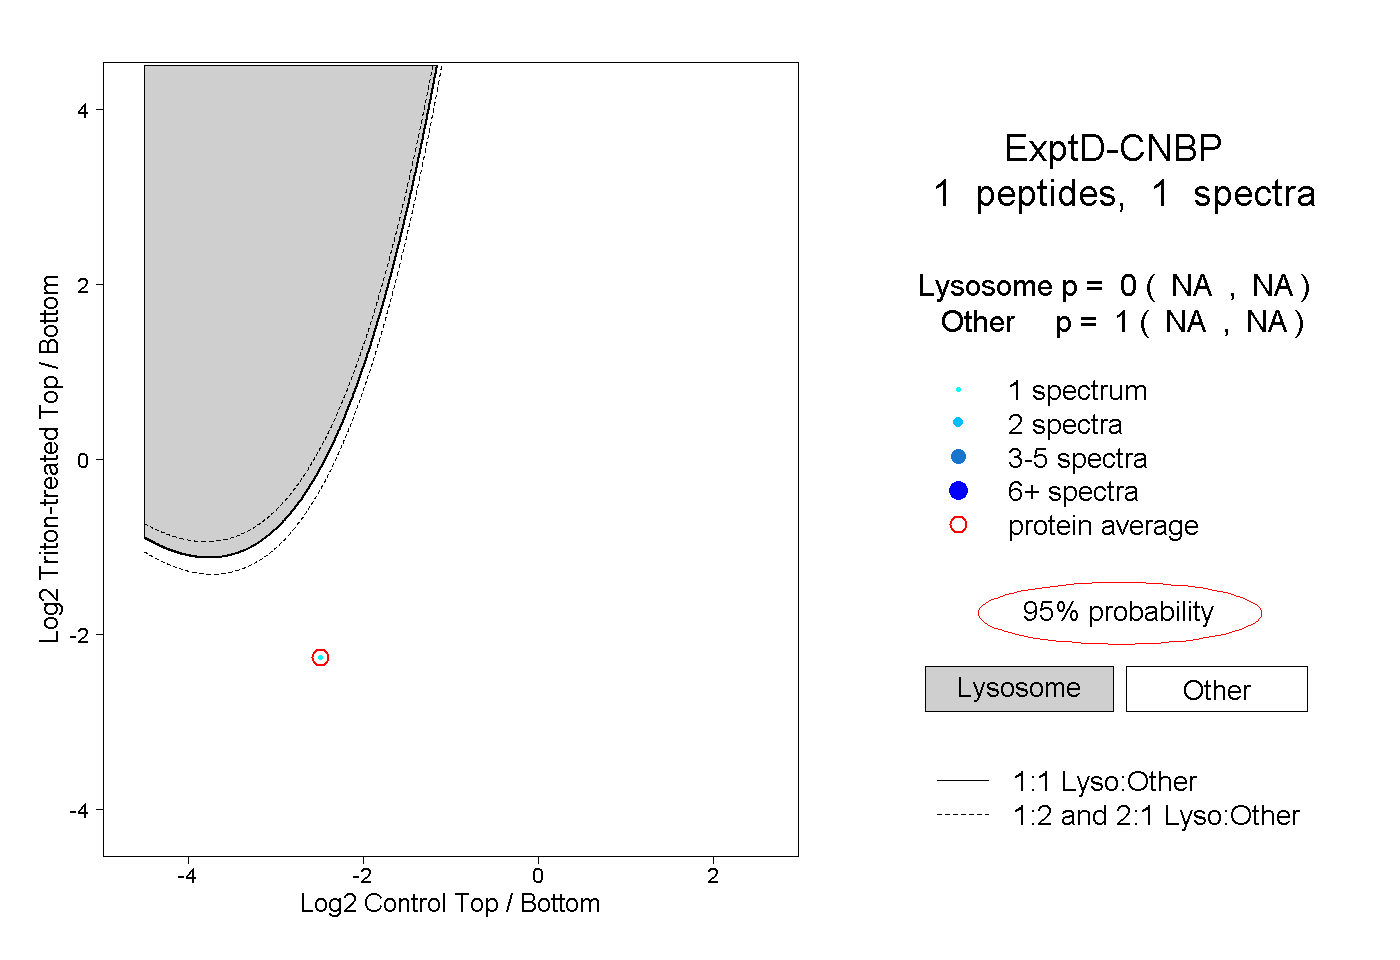 |
0.000 NA | NA |
1.000 NA | NA |